
Melbourne’s transport network has long been defined by its radial design—lines fanning out from the CBD like spokes on a wheel. This structure served a smaller, more compact city well into the 20th century, but rapid suburban growth, population pressures, and shifting work patterns have exposed its limitations. Commuters endure long, indirect journeys between outer and middle-ring suburbs, roads clog with cars, and major activity centres like Monash University, Box Hill, and Clayton remain poorly connected by rail. Enter the Suburban Rail Loop (SRL), Victoria’s ambitious 90-kilometre orbital metro project. Announced in 2018, it aims to create a fully automated, underground rapid transit system linking key suburban hubs without forcing passengers through the city centre.
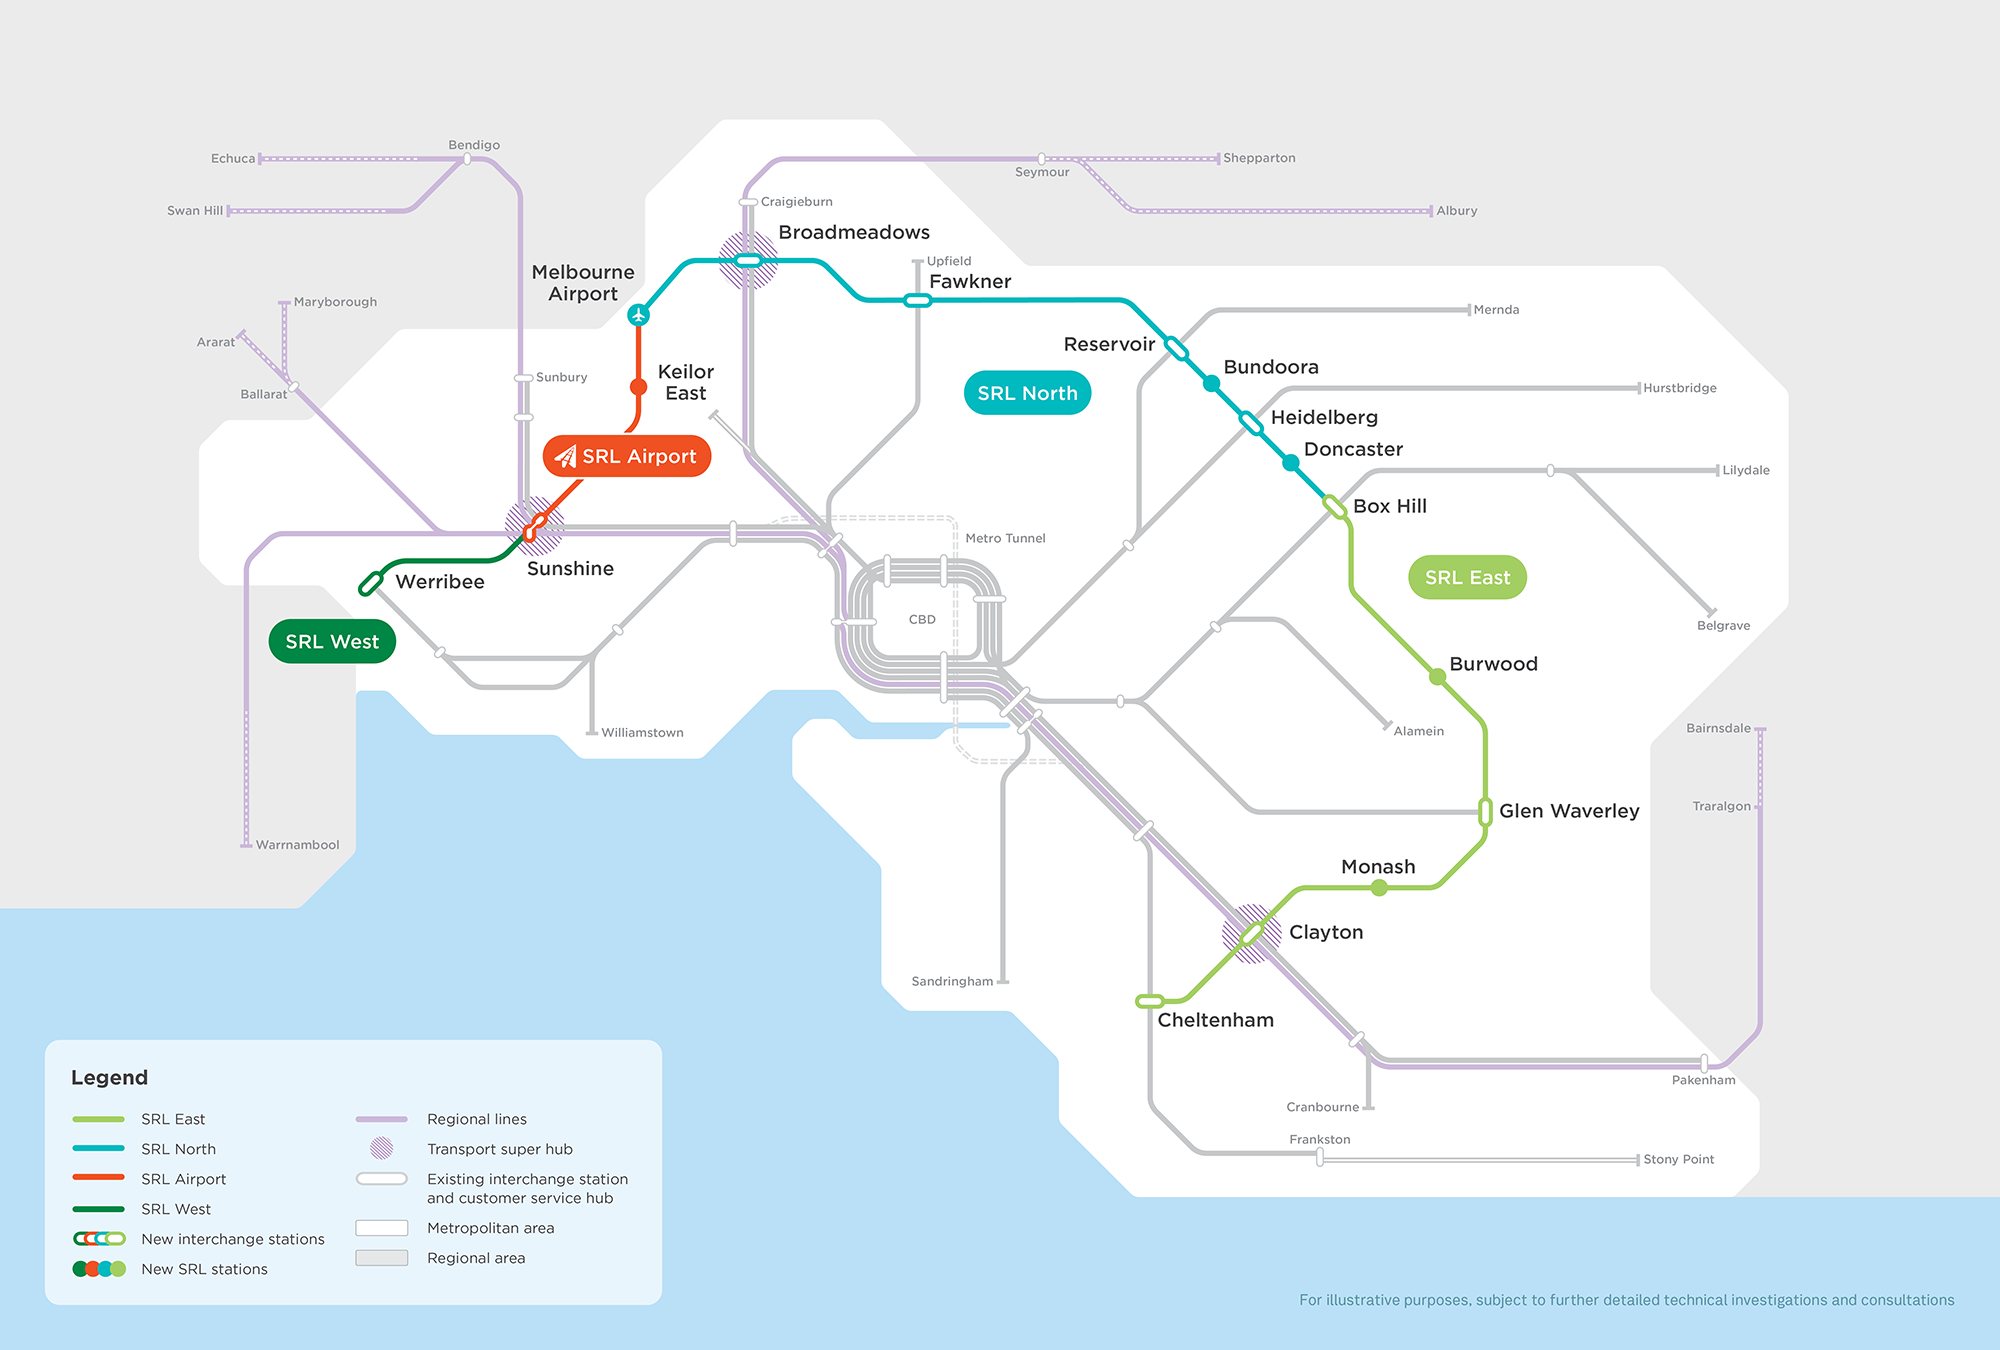
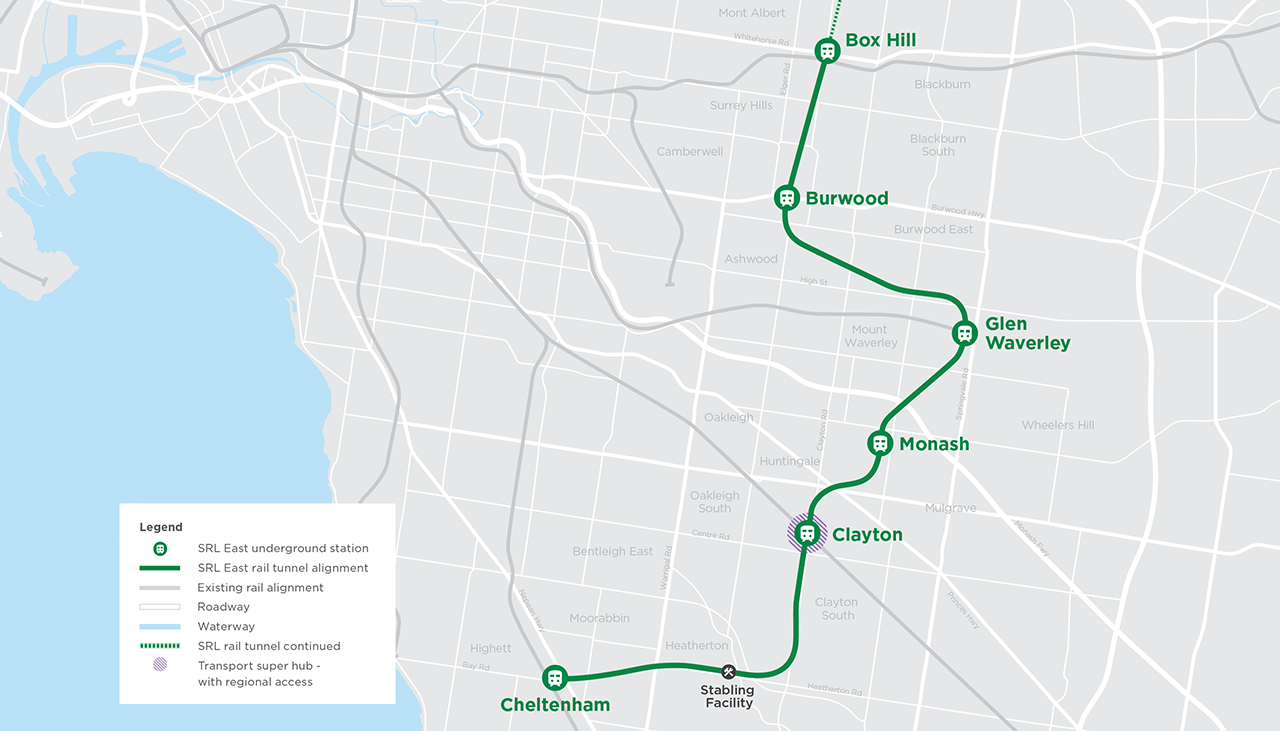
The SRL is not a single line but a multi-decade program divided into stages: SRL East (26 km from Cheltenham to Box Hill, six new stations at Cheltenham, Clayton, Monash, Glen Waverley, Burwood, and Box Hill), SRL North (extending to Reservoir and Melbourne Airport), and future western and airport segments. SRL East is under construction, with tunnelling preparations advancing in 2026 and passenger services targeted for 2035. Subsequent sections will follow over the 2040s and beyond.
This article, by ML Traffic Engineers Australia. examines the project through a rigorous, time-phased lens: short-term (roughly 2022–2035, dominated by construction), medium-term (2035–2050, partial operation), and long-term (2050 onward, assuming full network delivery). It draws directly from recent independent analyses—including the Victorian Parliamentary Budget Office (PBO) cost-benefit review, Infrastructure Australia’s 2025 Stage 3 evaluation, the government’s 2021 Business and Investment Case (BIC), and emerging research such as RMIT University’s 2026 agent-based transport modelling. The goal is a balanced, evidence-driven assessment of costs (capital, operational, environmental, social) against benefits (transport efficiency, economic growth, urban consolidation, emissions reduction). All figures are in present-value or nominal terms as reported; discount-rate sensitivities are highlighted because they dramatically affect viability.
Project Costs: The Overarching Picture
Capital costs for SRL East alone were estimated at $30–34.5 billion in the 2021 BIC (2020 dollars, including contingency). Independent updates paint a steeper picture. The PBO’s analysis of East plus North projected nominal build costs around $96 billion and operational costs of $120 billion over 50 years of service, for a combined $216.7 billion (2019–2084, unadjusted for inflation). Infrastructure Australia (IA) in 2025 expressed “low confidence” in the 2020 cost base, citing five years of design refinement and industry-wide escalation. Any further increases would erode the economic case without matching benefit growth.
Funding is split roughly one-third each from direct state investment (contracts already worth billions signed), value capture (levies and development contributions around stations), and federal contributions (now exceeding $6 billion after the 2026 budget). Critics, including an independent review by Pezala, argue the project overcapitalises on its objectives by at least $20 billion and risks becoming a “boondoggle” due to “too big to fail” dynamics.
Benefits are quantified via conventional transport user gains (time savings, reliability, mode shift), wider economic benefits (WEBs: agglomeration, productivity), urban consolidation (housing density, reduced sprawl), and environmental savings. The BIC projected $48.5–58.7 billion in total benefits for East + North at a 4% discount rate, yielding a benefit-cost ratio (BCR) of 1.1–1.7 and net present value (NPV) of $3–22.9 billion. The PBO, using the same benefit assumptions but a central 7% discount rate (Infrastructure Australia standard), found a negative NPV of –$7.4 to –$10.6 billion and BCR of 0.6–0.7. Only at 4% with every benefit category included does it turn positive (NPV $7.1–17.3 billion, BCR 1.2–1.4). IA noted the BIC overstated outcomes by including WEBs in core results, using optimistic vehicle operating cost assumptions, and failing to disaggregate East from later stages.
Short-term: Construction Dominates (2022–2035)
In the short term, costs are front-loaded and highly visible. Early and main works packages—tunnelling, station boxes, utilities—are underway, with peak employment reaching thousands. The BIC estimated up to 23,900 economy-wide jobs supported during construction (13,100 direct), delivering $23.6 billion in Victorian output (present value). SRL East alone is creating up to 8,000 direct roles, with community programs already generating hundreds of local opportunities.
Yet the price tag is enormous. Billions have already been committed; full East delivery will consume tens of billions more before any trains run. Community disruption—traffic management, noise, property impacts near alignments—is significant, though mitigated by underground design. Environmentally, construction emissions are estimated at 1.86 million tonnes CO₂-equivalent over 13 years—far exceeding the operational savings projected over a century (337,000 tonnes). Monetised at current carbon prices, this represents a $150–450 million economic hit not fully captured in the original CBA.
Benefits in this phase are primarily indirect and preparatory. Station precinct structure plans (finalised around 2026) lay groundwork for 70,000 new homes and hundreds of thousands of jobs by the 2050s. Value-capture mechanisms begin generating revenue. Some transport modelling shows early planning effects, but actual patronage and time savings are zero until 2035. The PBO treats pre-2022 sunk costs separately; post-2022 expenditure yields no operational return within the short term. Net result: substantial fiscal pressure and opportunity cost against competing priorities such as road maintenance, bus network expansion, or social housing. Independent analyses describe this period as a high-risk bet with deferred payoffs.
Medium-term: Partial Network Operation (2035–2050)
SRL East opens in 2035. Patronage forecasts from the BIC suggest approximately 71,000 daily trips in the first full year (2036), rising as integration improves. Travel times drop dramatically: Cheltenham to Box Hill in about 22 minutes; inter-precinct journeys up to 82 minutes faster one-way. Nearly half of passengers (47%) are projected to shift from cars, removing millions of vehicle kilometres daily once North comes online.
RMIT’s 2026 agent-based modelling (using Victorian travel diary data) adds nuance: SRL East is expected to boost walking in station precincts by 4.9–11.1%, with the largest gains among 20–24-year-olds (up to 11%) and late-20s adults (9.5%). This active-transport uplift supports health and local vibrancy beyond pure rail metrics.
Operational costs begin accumulating—station staffing, maintenance, energy, signalling. The PBO’s $120 billion nominal figure over 50 years underscores the long tail. Medium-term urban consolidation starts: mixed-use developments around Clayton, Monash, and Glen Waverley stations deliver housing and jobs, but full agglomeration benefits (WEBs) require SRL North (targeted 2043–2053). IA highlighted this timing mismatch: East’s standalone contribution cannot be isolated cleanly in the BIC, and full patronage/network effects are delayed 8–18 years.
Economic modelling projects thousands of net additional jobs during operations, plus initial GSP uplift. However, at 7% discounting the PBO found net societal costs persist even with urban and wider benefits included. Discount-rate choice is pivotal: lower rates (4%) favour long-lived infrastructure by valuing future generations more heavily, but standard public-sector guidance prefers 7%. Sensitivity testing shows the project becomes marginal with modest cost overruns (>20% build) or benefit shortfalls (>20%).
Socially, improved accessibility benefits outer-suburban residents, students at Monash/Deakin, and healthcare users. Environmentally, mode shift delivers modest emissions reductions, though construction debt remains. Overall, medium-term delivers tangible transport wins but still operates in a partial-network environment where benefits are building rather than fully realised.
Long-term: Full Network Legacy and Sustainability (2050+)
Assuming SRL North, Airport, and West segments are delivered (full 90 km by mid-century), the loop transforms Melbourne into a polycentric city. BIC forecasts exceed 430,000 daily passengers by 2056, with 2.2 million vehicle kilometres removed daily and up to 170 minutes return-trip savings on key corridors (e.g., Monash–Bundoora). Airport access improves dramatically (31,000 daily passengers).
Urban consolidation is the headline long-term benefit: 47,500+ new households and 165,000 attributable jobs in precincts, shrinking Melbourne’s urban footprint by an area the size of Shepparton. This reduces infrastructure duplication costs ($3.2–4.6 billion valued) and supports housing affordability and liveability. WEBs—productivity from better labour-market matching—add billions. Total Victorian GSP impact: $50.8 billion present value; Australia-wide GDP $49.3 billion.
Environmental gains accumulate: renewable-powered trains and car-mode shift yield $0.5 billion in present-value emissions savings, plus biodiversity and circular-economy benefits at stations. Active transport continues growing (2.4 million extra daily walking/cycling trips projected).
Yet costs endure. Operational expenditure, asset renewal, and debt servicing stretch across generations. The PBO’s 50-year horizon shows no payback within appraisal periods at 7% or 10% rates; even at 4% it stretches to 2072–2080. Political risk looms: state opposition has pledged to halt works if elected in 2026, potentially triggering sunk-cost losses or renegotiation. International comparisons (e.g., Paris Line 15) show similar orbital projects face delivery challenges and high per-kilometre costs.
Independent reviews caution against optimism. Pezala described the SRL as economically unsound and overcapitalised. IA urged exit strategies and updated, disaggregated analysis before further commitments. Benefit assumptions rely heavily on land-use change that requires sustained planning discipline.
Comparative Analysis, Risks, and Recent Research
| Source | Discount Rate | Benefits Scope | NPV ($B) | BCR | Key Caveat |
|---|---|---|---|---|---|
| Govt BIC (East+North) | 4% | All (incl. WEBs, urban) | +3.0 to +22.9 | 1.1–1.7 | Combined analysis; 2020 costs |
| PBO Central | 7% | All | –10.6 to –7.4 | 0.6–0.7 | Standard rate; net cost |
| PBO Low Rate | 4% | All | +7.1 to +17.3 | 1.2–1.4 | Matches BIC assumptions |
| IA 2025 (East focus) | Various | Overstated | Questioned | Lower | Low cost confidence; East alone weak |
Recent research reinforces nuances. RMIT modelling confirms behavioural shifts toward walking and public transport, particularly among younger cohorts—valuable for long-term health and mode-share goals. Comparative international reviews note that while suburban loops can reshape cities, success hinges on land-use integration and political continuity.
Uncertainties abound: cost escalation, patronage realism, climate events disrupting construction, and competing fiscal demands. Value capture may underperform if development slows. Alternatives—targeted bus rapid transit, existing-line upgrades, or aggressive planning reforms—were lightly assessed in the BIC, per IA and Auditor-General critiques.
Conclusion: Visionary Ambition Meets Fiscal Reality
The Suburban Rail Loop represents a generational bet on Melbourne’s future as a polycentric, sustainable metropolis. Short-term costs are steep—billions spent with disruption and emissions upfront—but lay foundations for jobs and precinct planning. Medium-term delivers the first real transport and active-mobility benefits, yet full value awaits later stages. Long-term promises transformative urban consolidation, economic output, and connectivity—if costs are contained, benefits materialise, and political will endures.
Independent analyses (Victorian Parliamentary Budget Office, Infrastructure Australia) temper the government’s optimism: at standard discount rates the project shows net costs unless optimistic assumptions hold. Recent modelling on walking and behaviour adds supportive evidence for liveability gains, but does not resolve core economic sensitivities.
Ultimately, the SRL’s success will be judged not by contracts signed today but by whether the completed network reshapes suburban life for decades without crippling public finances. Victoria’s planners and policymakers must maintain transparency, update CBAs with current costs, and prepare robust contingencies. For a city growing as fast as Melbourne, bold infrastructure is necessary; whether this particular bold vision delivers net benefits across all time horizons remains an open, evidence-dependent question. The coming years of construction and the first trains in 2035 will provide the real-world test.
ML Traffic Engineers Australia: Expertise in Complex Infrastructure Contexts
ML Traffic Engineers Australia brings over 30 years of professional experience to the civil engineering and urban planning sectors. We specialize in navigating high-stakes infrastructure projects for private developers who require technical certainty. Our firm understands the intricacies of the national transport pipeline and how these investments translate to local site constraints. This specialized knowledge is essential for determining how future infrastructure projects affect your development application. We ensure your documentation meets the rigorous standards of both local councils and state transport authorities from the initial submission.
Our senior principals personally handle all technical work. We do not use junior gatekeepers or inexperienced staff to draft reports. This hands-on approach allows ML Traffic Engineers Australia to minimize council RFIs through meticulous, data-driven reporting that anticipates assessor concerns. We provide a comprehensive suite of traffic engineering services designed for technical compliance and operational efficiency:
- Traffic Impact Assessment (TIA) Reports
- Vehicle Swept Path Analysis
- Car Parking Demand Assessment
- Traffic Guidance Scheme (TGS)
- Driveway Ramp Grade Assessment
- Intersection Analysis
- Sight Distance Assessment
- Car Park Design
