

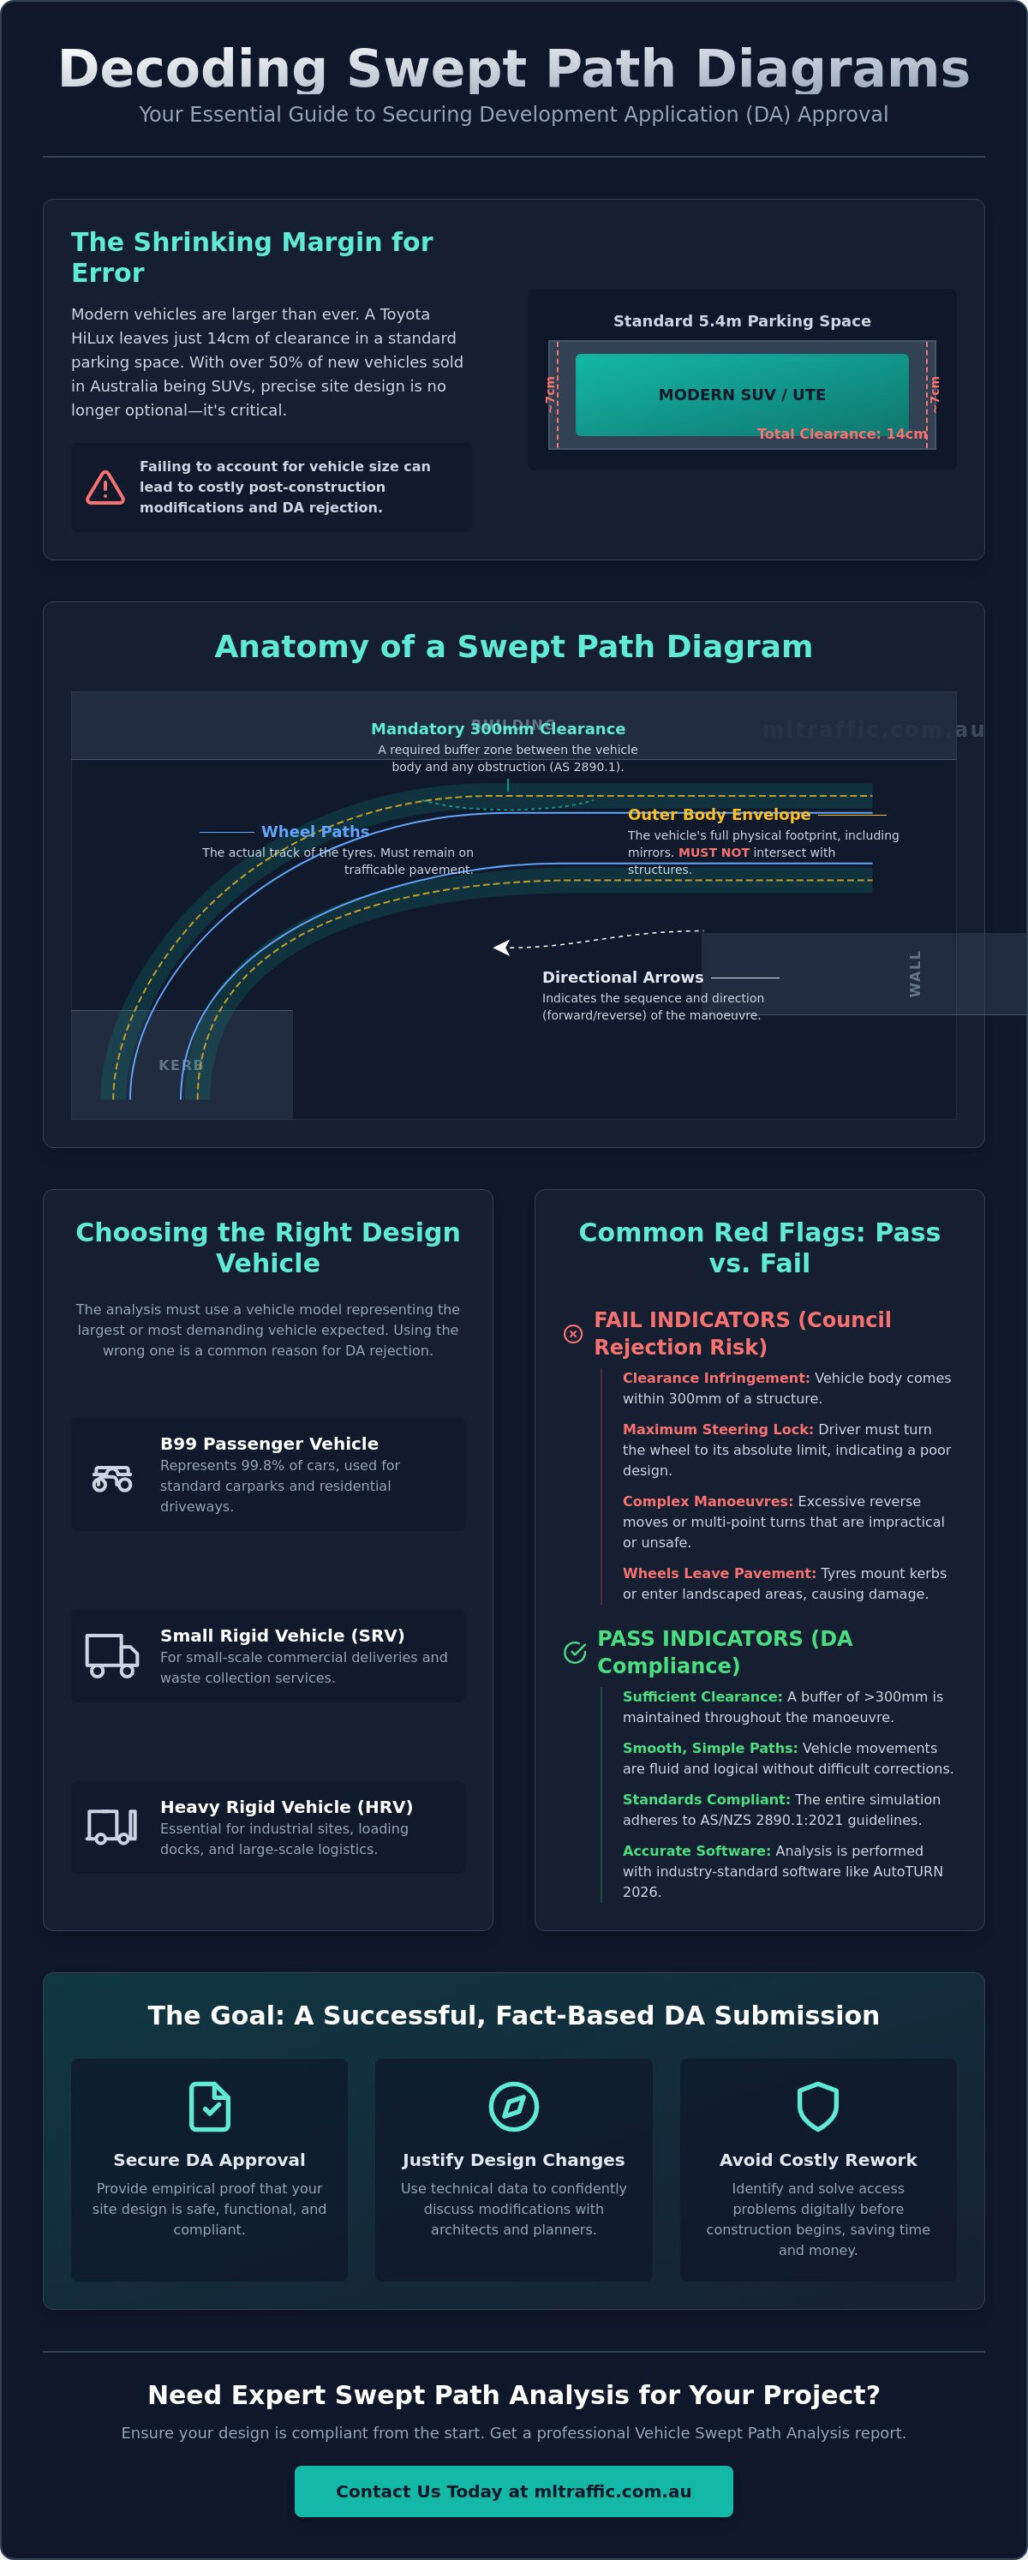
Did you know the Toyota HiLux now leaves only 14 centimeters of clearance in a standard 5.4-meter parking space? With over 50% of new vehicles sold in Australia being SUVs, the margin for error in site design has vanished. For developers, knowing how to read and interpret a swept path diagram isn’t just a niche engineering skill. It’s a critical requirement for securing a Development Application (DA) and avoiding expensive post-construction modifications.
It is common to feel overwhelmed by the technical symbology and colored arcs that dominate these reports. You need to know if your site plan actually works before it reaches the council. This guide provides the technical expertise to decode these simulations, ensuring your project aligns with AS/NZS 2890.1:2021 and AS 2890.2:2026. You’ll learn to identify a “pass” or “fail” result at a glance, understand clearance requirements for various vehicle types, and gain the confidence to discuss design changes with your traffic engineer.
Key Takeaways
- Distinguish between the outer body envelope and internal wheel paths to understand the full physical footprint of a vehicle during a manoeuvre.
- Master how to read and interpret a swept path diagram by identifying mandatory 300mm clearance margins required for compliance with AS 2890.1:2021.
- Identify critical design red flags, such as vehicles reaching maximum steering lock or requiring overly complex reverse manoeuvres that risk council rejection.
- Use technical swept path data to justify design modifications to architects and present a fact-based case to council planning officers.
- Ensure all Vehicle Swept Path Analysis reports utilize current industry-standard software like AutoTURN 2026 to guarantee geometric accuracy.
What is a Swept Path Diagram and What Does it Represent?
A swept path diagram is a precise technical overlay that illustrates the horizontal space required by a vehicle as it executes a specific manoeuvre. It maps the movement of both the vehicle’s outer body and its wheel paths across a site plan. Unlike basic hand-drawn sketches, these diagrams serve as a digital test drive of your proposed design. They are generated using advanced vehicle swept path analysis software like AutoTURN 2026. This technology ensures that every arc and clearance margin complies with the strict geometry defined in Australian Standards.
Understanding how to read and interpret a swept path diagram is essential for any developer managing a project through the council approval process. These diagrams are considered the gold standard for Development Applications (DA) because they provide empirical proof that a site can safely accommodate the vehicles intended for it. A static vehicle template only shows a single footprint, but a dynamic swept path simulation accounts for the transition between steering angles and the physical swing of the vehicle body. Council planning officers rely on these simulations to eliminate guesswork and mitigate the risk of structural damage or traffic congestion.
To better understand this concept, watch this helpful video:
The Concept of the Design Vehicle
Every analysis begins with the selection of a design vehicle. This is a standardized model that represents the largest or most demanding vehicle expected to use the facility. Common models include the B99 vehicle, which represents the 99.8th percentile of passenger cars, or the Heavy Rigid Vehicle (HRV) for industrial loading docks. The vehicle’s length, width, and wheelbase dimensions directly dictate the envelope shown on the plan. Choosing the wrong vehicle for your test is a frequent cause of immediate council rejection. If your project involves a commercial loading bay but only uses a Small Rigid Vehicle (SRV) for the simulation, the council will likely issue a Request for Information (RFI) or reject the design entirely.
Static vs. Dynamic Manoeuvres
A professional Vehicle Swept Path Analysis distinguishes between static footprints and dynamic movement. The simulation accounts for variables like travel speed and steering lock speed. For instance, a vehicle turning at 5 km/h requires a different path than one performing a stationary turn. Most diagrams illustrate stop-start manoeuvres, where the driver may need to adjust steering while the vehicle is stationary. You must identify the specific start and end points of the simulated movement on your plan to ensure the entire manoeuvre, including the entry and exit, remains within legal boundaries. This level of detail is what separates a compliant site design from one that fails during construction.
Decoding the Visual Elements: Lines, Colours, and Layers
Learning how to read and interpret a swept path diagram requires a granular understanding of the engineering legend. Every line and colour on the page serves a specific regulatory purpose. The Outer Body Envelope is the most critical feature for developers. It represents the physical boundary of the vehicle, including mirrors and body overhangs. This line must never intersect with structural elements on your site plan. In contrast, the Wheel Path represents the actual track of the tyres. While a vehicle body might safely overhang a kerb in specific low-speed manoeuvres, the wheel path must remain strictly within the trafficable pavement to avoid damaging landscaping or infrastructure.
Directional arrows are essential for understanding the logical sequence of a movement. These markers indicate whether the vehicle is moving forward or in reverse. This is particularly important for assessing the complexity of three-point turns or loading dock entries. For projects involving steep transitions, engineers also monitor chassis clearances to identify if low-hanging vehicle components will strike the ground. Referencing official benchmarks like the Metrolinx Civil Engineering Standard helps define these Clearance Envelopes and horizontal buffers with precision.
Understanding Line Styles and Colours
Engineers use a standardized colour palette to ensure clarity. Body paths are frequently rendered in green, while wheel paths appear in red. This distinction allows you to see at a glance if a tyre is clipping a kerb even if the body clears it. Solid lines represent the continuous path of the vehicle, while dashed lines often indicate a multi-point turn where a driver must stop and change direction. You will also notice “ghosted” vehicle outlines at critical points of the turn. These snapshots show the vehicle’s exact position at the most demanding part of the manoeuvre, such as the peak of a 90-degree turn. When reviewing your preliminary plans, ensuring your consultant provides a clear legend is vital for a professional Vehicle Swept Path Analysis.
The Role of the Site Underlay
The accuracy of the analysis depends entirely on the site underlay. You must verify that the engineering diagram is scaled correctly to your most recent architectural site plan. A common error occurs when an outdated plan is used, leading to “ghost” conflicts with walls or columns that have since been moved. The background plan must reflect the current design iteration, including all kerbs, columns, fire boosters, and landscaping features. If the underlay is inaccurate, the swept path results are legally indefensible during a council audit. Effective communication between your architect and traffic engineer ensures that every potential physical obstruction is accounted for before the report is finalized. This meticulous approach is what determines how to read and interpret a swept path diagram effectively during a high-stakes design review.
How to Interpret Clearance Margins and Envelopes
The Envelope of Movement represents the total operational footprint of a vehicle during its path of travel. It’s not merely the vehicle’s physical dimensions; it includes the mandatory safety buffers required by Australian Standards. Understanding how to read and interpret a swept path diagram involves verifying these margins against your specific site constraints. For most residential and commercial developments, the 300mm clearance rule is the industry benchmark. This rule mandates that the outermost edge of the vehicle body, typically represented by the green envelope, must maintain a minimum 300mm offset from all permanent structures like columns, fire hydrants, or walls.
You can verify these clearances digitally. Use the measurement tool in your PDF viewer to check the distance between the body path and the architectural boundary. If the gap is less than 300mm, the manoeuvre is technically non-compliant. You should also look for blind spots within the diagram. These are areas where the vehicle’s path is obscured by site features, potentially creating safety risks that a council officer will flag during a Traffic Impact Assessment review. Professional Vehicle Swept Path Analysis will clearly delineate these safety zones to ensure your design is robust and defensible.
Clearance Requirements for Different Vehicle Classes
Clearance needs vary significantly between vehicle types. A standard car parking manoeuvre using a B99 vehicle requires less buffer space than a Heavy Rigid Vehicle (HRV) in a loading dock. Loading docks often require larger buffer zones, sometimes 500mm or more, to account for trailer swing and driver error. You must also distinguish between overhangs and ground-level obstructions. A vehicle body may safely pass over a 150mm kerb, which is an “overhang,” but it cannot pass over a 2m high structural column. If your diagram shows the body envelope crossing a wall, the design will fail the council audit regardless of where the wheels are positioned.
The “Pass/Fail” Visual Check
A “Pass” is a body envelope that maintains required offsets from all fixed objects. This is the simplest way to determine if your site design is compliant at a glance. You must also watch for “Kerb Strikes.” A kerb strike occurs when the internal wheel path, usually the red line, intersects with a raised edge or landscaping. While the vehicle body might clear the area, the tyres hitting a kerb can lead to structural damage or tyre wear over time. Finally, pay attention to the “swept area” shading. This shaded region represents the total conflict zone. If this shading overlaps with any critical infrastructure or pedestrian pathways, you have identified a high-risk area that needs immediate architectural revision before your DA submission.
Common Red Flags and Interpretation Errors
Identifying errors is just as vital as understanding the basic engineering legend. A common red flag when learning how to read and interpret a swept path diagram is the “Tight Turn” trap. Software can calculate a path using the vehicle’s absolute maximum steering lock. In reality, drivers don’t operate at these mechanical extremes. If your diagram shows the wheels at their limit, the design leaves zero room for error. This increases the likelihood of site damage or failed council inspections during the post-construction audit.
Reverse manoeuvres present another significant risk. Three-point turns must be clearly articulated and manageable for the average driver. If the simulation requires a complex, multi-stage reverse path just to enter a standard parking bay, council officers will likely flag it as an operational hazard. You should also watch for overlapping paths. When multiple vehicle movements are displayed on a single sheet, they can obscure conflict zones. Ensure each movement is sequenced logically and that the “swept area” shading doesn’t hide potential strikes with columns or fire boosters.
Inconsistent scaling is a subtle but fatal error. If the B99 vehicle looks suspiciously small compared to a standard 5.4-meter parking bay, the diagram’s scale is likely incorrect. This usually happens when the engineering overlay doesn’t match the scale of the architectural underlay. Mastering how to read and interpret a swept path diagram involves spotting these visual mismatches before they reach the DA submission stage. If the vehicle dimensions are skewed, the entire compliance report becomes legally indefensible.
Ignoring Vertical Clearances
A 2D swept path analysis provides a horizontal view but ignores the Z-axis. This is a critical oversight for basement entries and multi-level facilities. Even if the horizontal path clears all structural columns, the vehicle might “ground” on a steep transition or strike low-hanging overhead services. We recommend integrating your analysis with a professional Driveway Ramp Grade Assessment to ensure vertical compliance and avoid costly structural modifications later.
Software Defaults vs. Real-World Logic
Software like AutoTURN 2026 uses default parameters that may not reflect real-world driving conditions. For example, “lock-to-lock” time, the time it takes a driver to turn the wheel from one side to the other, must be manually adjusted by the engineer. If the simulation assumes an instantaneous steering change, the path is physically impossible for a human driver to replicate. A professional engineer must override these defaults to produce a reliable Vehicle Swept Path Analysis that stands up to council scrutiny.
If you spot these red flags in your current plans, contact our senior principals for a technical review of your Vehicle Swept Path Analysis.
Turning Your Interpretation into a Successful DA
A technical understanding of your site’s geometry is only valuable if it leads to a successful Development Application (DA). Once you master how to read and interpret a swept path diagram, you can use that data as a powerful tool for design coordination. If the simulation shows a body strike against a structural column, you have the empirical evidence needed to justify design changes to your architect. Instead of relying on subjective opinions, you provide a fact-based requirement for shifting a wall or widening a driveway. This proactive approach prevents the costly delays associated with redesigning a project after it’s been submitted to the council.
A compliant Vehicle Swept Path Analysis must be supported by a comprehensive Traffic Impact Assessment report. This document contextualizes the diagrams, explaining how the site meets the specific requirements of AS/NZS 2890.1:2021 and local council DCPs. For a DA to be legally valid, it requires a signed certification from a qualified traffic engineer. This signature confirms that the manoeuvres shown are not only software-compliant but also physically achievable and safe for the end user. Presenting this evidence with confidence demonstrates to council planning officers that your project is meticulously planned and operationally sound.
Responding to Council Requests for Information (RFI)
When a council issues a Request for Information (RFI) regarding vehicle access, they often specify a particular vehicle type or a challenging manoeuvre, such as a waste collection vehicle entering a basement. You must read these requests carefully to understand the specific “fail” point the council is concerned about. A strategic response often includes “Option A vs. Option B” diagrams. By showing a non-standard design alongside a compliant swept path, you can prove that your specific solution works despite deviating from traditional templates. This technical transparency is essential for negotiating variances in tight urban sites where standard dimensions are impossible to achieve.
Partnering with a Seasoned Traffic Expert
Navigating national regulatory standards requires more than just software; it requires over 15 years of industry experience. ML Traffic Engineers Australia provides a hands-on, accountable service where the same expert who initiates the project performs the technical work. This personnel continuity ensures that the nuances of your site are never lost in a larger firm’s bureaucracy. Our senior principals are directly accessible to discuss your report and defend the results before council if required. We specialize in identifying the most efficient vehicle paths to maximize your site’s yield while maintaining absolute compliance.
If you require a technical review of your site plans or a certified analysis, Contact ML Traffic Engineers Australia today to ensure your project meets all Australian Standards for vehicle movement.
Secure Your Development Approval with Technical Precision
Understanding the technical nuances of vehicle movement ensures your project transitions from a site plan to a compliant physical structure. You now possess the foundational knowledge to differentiate between body envelopes and wheel paths, identify critical clearance failures, and spot software-driven errors that lead to council RFIs. Mastering how to read and interpret a swept path diagram allows you to lead design discussions with architects and planning officers from a position of technical authority. Don’t leave your DA approval to chance by relying on default software settings that lack real-world logic.
For complex sites where every millimeter counts, rely on a specialist. ML Traffic Engineers Australia brings 15+ years of Australian consultancy experience to your project, guaranteeing compliance with AS 2890.1 and AS 2890.2. You’ll have direct access to our senior principals, ensuring the expert who starts your project is the one who completes the technical analysis. Request a Professional Swept Path Analysis for Your Project to ensure your site design is defensible and ready for construction. We look forward to helping you secure a successful outcome for your development.
Frequently Asked Questions
What is the most common mistake when reading a swept path diagram?
The most common mistake is focusing solely on the wheel path rather than the outer body envelope. While the wheels may clear a kerb, the vehicle’s body or mirrors might strike a structural column or wall. Understanding how to read and interpret a swept path diagram requires checking the outermost boundary line. This ensures the entire vehicle footprint, including overhangs, remains within the trafficable area without impacting site infrastructure.
Do I need a separate swept path for every parking space in my development?
You don’t typically need a simulation for every single bay. Engineers focus on the “critical” spaces, which are the ones most difficult to access due to proximity to walls, columns, or tight turn-arounds. If the most constrained bay passes the analysis, the council accepts that the more accessible bays are also compliant. This targeted approach reduces reporting complexity while maintaining rigorous safety standards for the development.
What does “B99 vehicle” mean on my swept path report?
A B99 vehicle represents the 99.8th percentile of the Australian passenger car fleet. It’s a standardized design vehicle used to ensure parking facilities accommodate large SUVs and luxury sedans. Designing for the B99 vehicle ensures that almost every passenger car on the road can safely use your site. This is the mandatory benchmark for off-street car parking under Australian Standard AS/NZS 2890.1:2021.
Can a swept path diagram prove that a truck can enter my loading dock?
A swept path analysis provides empirical proof of truck accessibility for loading docks. By simulating a Heavy Rigid Vehicle (HRV) or Articulated Vehicle (AV), the diagram shows exactly how much space the truck needs to reverse and dock. This eliminates guesswork during the design phase. It also confirms that the vehicle can enter and exit the site in a forward direction, which is a common council requirement.
Why does the council insist on a 300mm clearance margin?
Councils mandate a 300mm clearance margin to account for human error and vehicle variability. This buffer provides a safety zone between the vehicle’s body envelope and fixed objects like walls or fire boosters. Without this margin, a driver would need to execute a perfect manoeuvre every time to avoid a collision. Adhering to this offset is a non-negotiable part of securing a compliant Traffic Impact Assessment and meeting Australian Standards.
How much does a professional swept path analysis usually cost for a DA?
The cost of a professional analysis depends on the complexity of the site and the number of vehicle movements required. Factors such as the variety of design vehicles, the number of access points, and whether the site has steep gradients will influence the final fee. Developers should request a tailored quote based on their specific architectural plans to ensure all council requirements are met without unnecessary expenditure on redundant simulations.
What software is used to create these vehicle turning path diagrams?
Professional traffic engineers use specialized software like AutoTURN 2026 to generate these diagrams. This software integrates with CAD platforms to provide precise, dynamic simulations based on the geometric properties of standardized design vehicles. These tools are far more accurate than static templates. They allow engineers to account for steering lock speeds and transitional arcs, which is essential for modern site designs and council audits.
Is a swept path analysis required for residential driveways?
Residential driveways often require a swept path analysis if the design involves multi-dwelling developments or challenging gradients. Councils use these diagrams to verify that residents can safely enter and exit the property without reversing onto busy roads. Learning how to read and interpret a swept path diagram is particularly useful here to ensure the driveway width and turning circles accommodate a standard B85 or B99 vehicle.

Disclaimer
The content on www.mltraffic.com.au, including all technical articles, guides, and resources, is provided for general informational and educational purposes only. It is not intended to constitute professional advice in traffic engineering, transportation planning, development approvals, or any other technical or legal field.
While ML Traffic Engineers makes every reasonable effort to ensure the accuracy, completeness, and timeliness of the information published, we do not provide any warranties or representations (express or implied) regarding its reliability, suitability, or availability for any particular purpose. Any reliance you place on the content is strictly at your own risk.
In no event shall ML Traffic Engineers, its directors, employees, authors, or affiliates be liable for any direct, indirect, incidental, special, consequential, or punitive damages (including, without limitation, loss of profits, data, or business opportunities) arising out of or in connection with the use of, or inability to use, any information provided on this website.
The articles and guides on this site are not a substitute for engaging a qualified, registered professional traffic engineer (such as an NPER or RPEQ engineer) to assess your specific project requirements. For tailored advice, compliance assessments, or traffic engineering services, please contact a competent professional.
This disclaimer may be updated from time to time without notice. By accessing or using this website, you agree to be bound by the most current version of this disclaimer.
