

A single “unrealistic” data point in your traffic model can cost your development months in council delays and thousands in re-modelling fees. You’ve likely experienced the frustration of a Council rejecting a Traffic Impact Assessment (TIA) because theoretical SIDRA outputs don’t align with the actual congestion observed on-site. It’s an avoidable bottleneck that stalls planning approvals and drives up project costs.
We believe that empirical evidence is the only way to bypass these bureaucratic hurdles. This guide explains how a professional queue length survey for intersection analysis provides the “ground truth” required for a compliant TIA. By capturing precise field data, you ensure your intersection analysis reflects real-world conditions rather than just a best-case simulation.
We’ll examine the technical requirements of SIDRA 11.0.3 and the 2026 Austroads Guide to Traffic Management updates. You’ll also see how senior-led data collection ensures your report is right the first time, helping you secure council approval with minimal RFI cycles and total confidence in your project’s traffic outcomes.
Key Takeaways
- Understand why empirical data serves as the essential “ground truth” that prevents Council from rejecting theoretical models in your Traffic Impact Assessment.
- Learn how to select the most effective queue length survey for intersection analysis by comparing high-accuracy manual counts with the long-term trends captured through video analytics.
- Discover the process of calibrating SIDRA software parameters to ensure your modelled results accurately reflect real-world driver behaviour and saturation flows.
- Identify common red flags in planning applications that trigger Council RFIs, specifically regarding discrepancies between modelled delays and known local congestion points.
- See how senior-level oversight and personnel continuity ensure that the technical data collected in the field is accurately translated into a defensible planning report.
Understanding Queue Length Surveys in Intersection Analysis
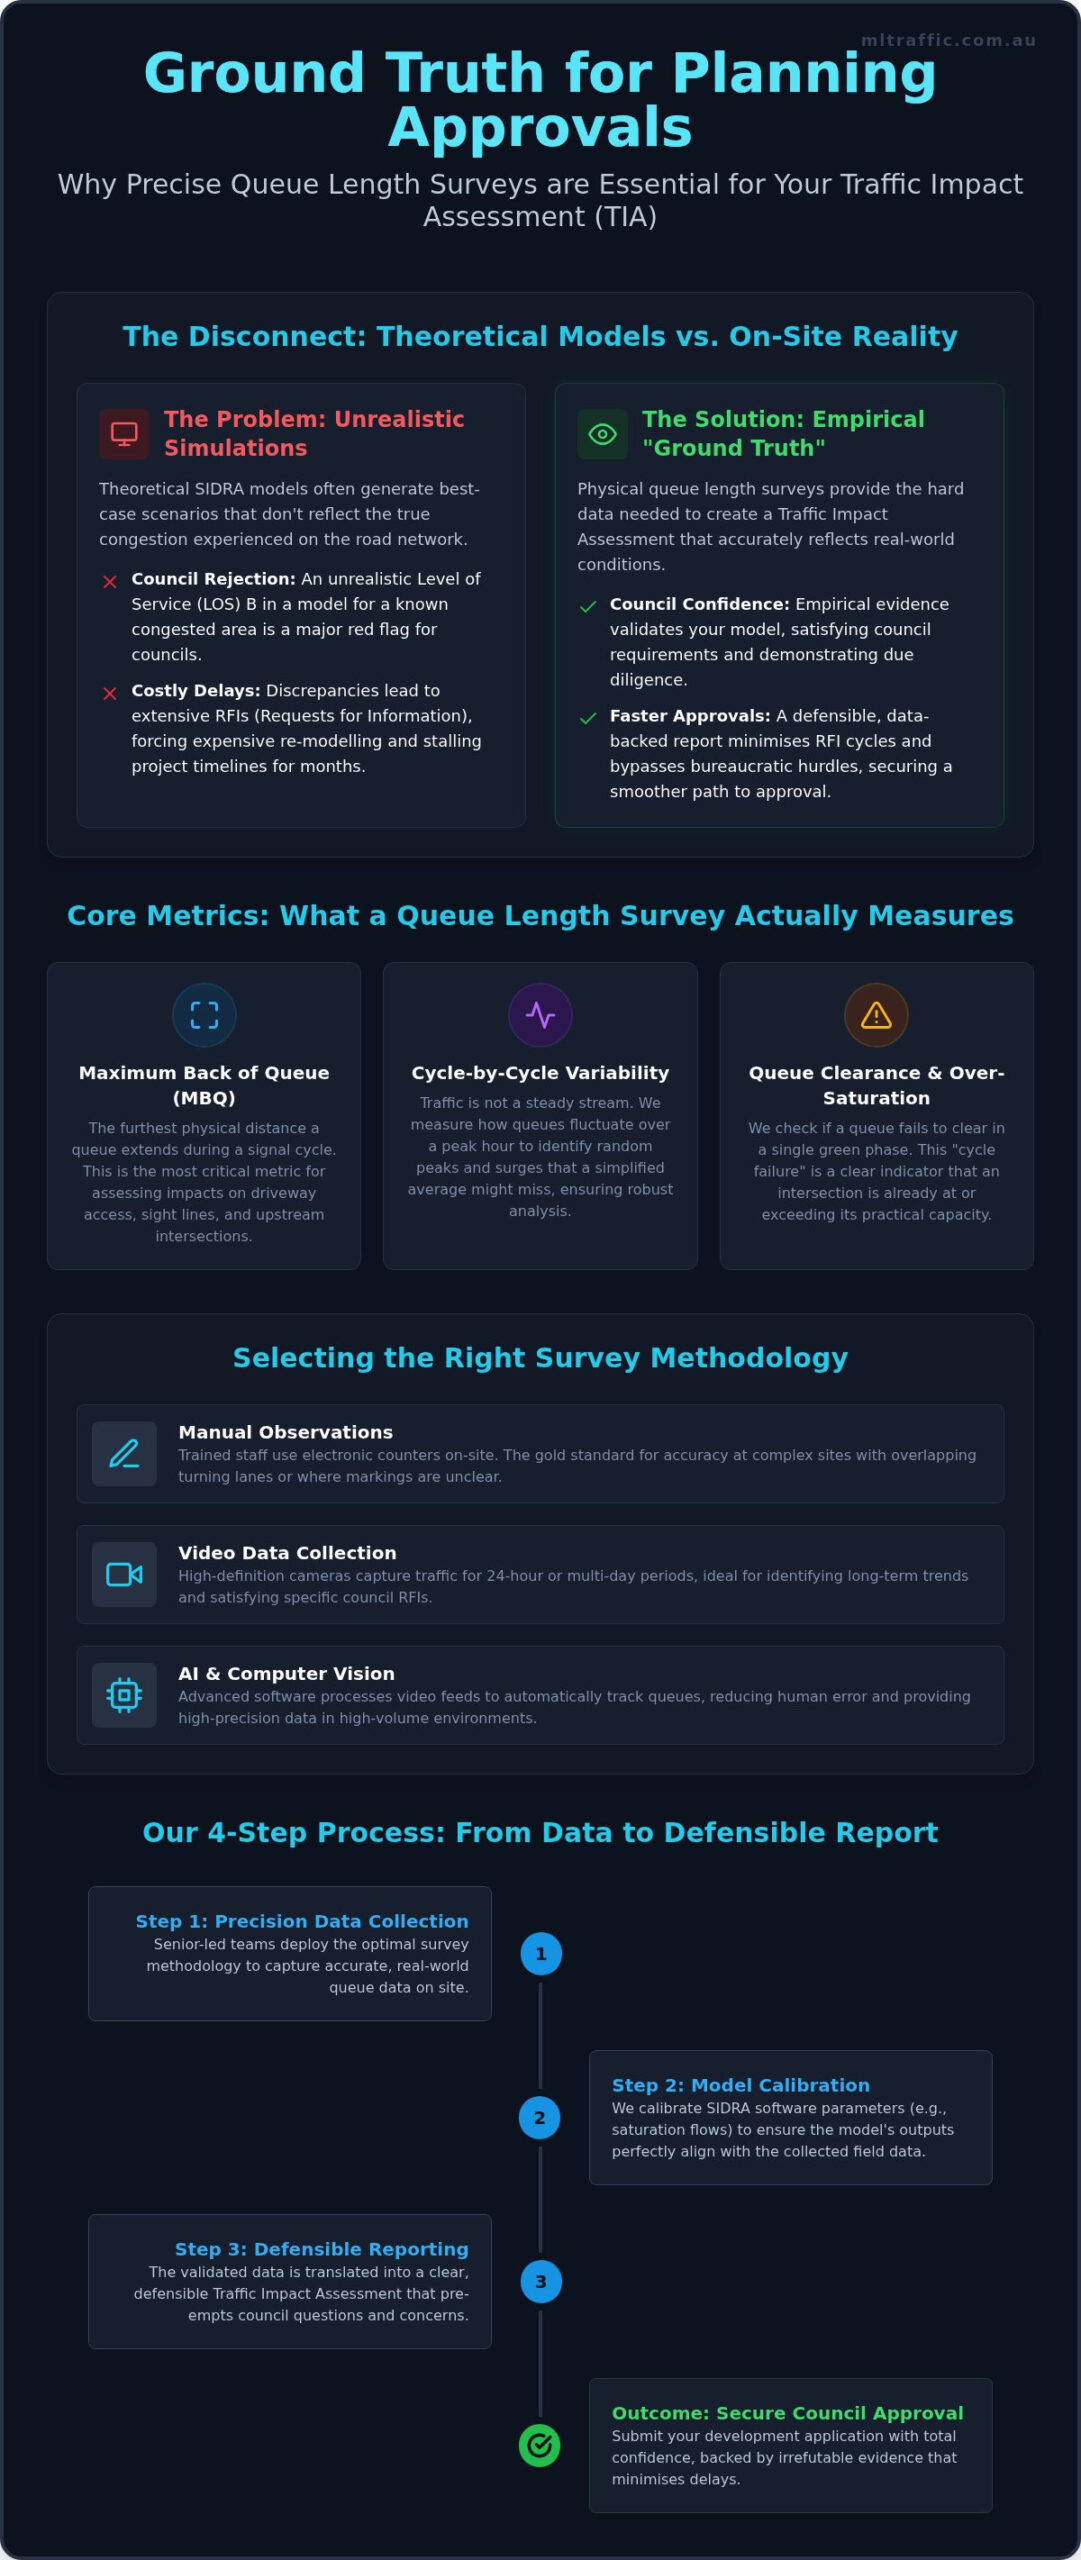
A queue length survey for intersection analysis is a rigorous data collection process that records the physical extent and duration of vehicle queues at specific approaches. Unlike standard volume counts, these surveys focus on the spatial footprint of congestion. Theoretical models often struggle to replicate the “back of queue” growth seen on complex Australian road networks, especially where short lane lengths or closely spaced intersections exist. By measuring the actual physical line of vehicles, we provide the empirical evidence required for an accurate Intersection Analysis.
This empirical data is grounded in fundamental traffic flow principles, where the relationship between density and speed dictates how quickly a queue dissipates. Standard counts might tell you how many cars pass through a light. They don’t tell you if the queue stretched 150 metres back and blocked a critical development driveway. Maximum back of queue (MBQ) measurements capture this peak extent. This validates the existing performance of the network before any new development traffic is even considered.
Key Metrics: What is Actually Measured?
- Maximum Back of Queue (MBQ): This is the furthest physical point the queue reaches during a red cycle. It’s the most critical metric for assessing sight distance and driveway access.
- Cycle-by-cycle variability: Traffic isn’t a steady stream. We capture how queues fluctuate over a standard peak hour to identify random peaks that a simplified average might miss.
- Queue clearance: We monitor if a queue fails to clear in a single green phase. This “over-saturation” indicates an intersection is already at or exceeding its practical capacity.
When is a Physical Survey Mandatory?
Councils often require a physical queue length survey for intersection analysis when they suspect existing congestion is near capacity. This is standard for high-density developments like residential towers or large retail centres where even small traffic increases could cause network failure. If your theoretical SIDRA results show a Level of Service (LOS) B, but the local councillor knows that traffic regularly backs up two blocks, a physical survey is the only way to resolve the discrepancy. It’s about replacing assumptions with hard facts to secure your planning approval.
Survey Methodologies: From Manual Counts to Video Analytics
Selecting the correct methodology for a queue length survey for intersection analysis is a technical decision based on site complexity and Council requirements. We utilise several distinct approaches to ensure the resulting data is both accurate and defensible during the planning phase:
- Manual Observations: Trained staff use electronic tally counters to record the exact moment a vehicle joins the end of a queue. This is the gold standard for intricate sites where overlapping turning lanes or faded markings might confuse automated systems.
- Video Data Collection: High-definition cameras monitor the site for 24-hour or multi-day periods. This captures long-term trends and allows for a comprehensive review of traffic patterns beyond a single peak hour.
- AI and Computer Vision: Advanced software processes video feeds to automatically track queue lengths and delay times. This technology reduces human error and provides high-precision data in high-volume environments.
- GPS and Bluetooth Data: Floating car data tracks individual vehicle progress through an intersection centre. This provides insights into broader network delays and travel time reliability.
As noted in the FHWA Traffic Signal Timing Manual, queue length is a critical performance measure for determining if signal timing is optimised or failing under current volumes.
Choosing the Right Method for Your Development
Manual counts are often best for complex signalised intersections with multiple turning lanes where AI might struggle with vehicle occlusion. Video is preferred for remote sites or when multi-day data is required to satisfy a specific Council Request for Information (RFI). We prioritise weather-neutral data collection. This prevents external factors, such as heavy rain or storm events, from producing outlier data that could lead to unnecessary and expensive infrastructure requirements.
Data Accuracy and Quality Control
Raw data sets are prone to anomalies. Drivers frequently engage in queue jumping or erratic lane-changing behaviour that can confuse automated sensors. A senior traffic engineer must verify all data sets to filter out these inconsistencies. Our analysis identifies the busiest 15-minute window within the morning or afternoon peak to ensure we capture the true “peak of the peak” hour. Meticulous detail at this stage ensures your queue length survey for intersection analysis stands up to the highest level of scrutiny and supports a robust Intersection Analysis.
The Role of Queue Data in SIDRA Modelling and Capacity Analysis
SIDRA modelling is only as reliable as the empirical inputs provided. A queue length survey for intersection analysis provides the calibration points required to ensure the digital twin matches the physical road environment. Without this data, software defaults to generic values that often fail to reflect specific local driver behaviour or restricted intersection geometries. We utilise SIDRA INTERSECTION version 11.0.3 to process this data, ensuring compliance with the latest software standards released in July 2026.
Calibrating the SIDRA Model
Councils often reject Traffic Impact Assessments when the modelled results conflict with known congestion. We use observed data to refine “Basic Saturation Flow” and “Gap Acceptance” settings. This ensures the Degree of Saturation (DOS) in the model matches the physical queue length measured in the field. As detailed in the FHWA Traffic Monitoring Guide, robust data collection is essential for any transport policy or planning decision. We measure the time headway between departing vehicles to calculate the actual saturation flow rate of a specific lane, replacing theoretical assumptions with site-specific facts.
The 2026 updates to the Austroads Guide to Traffic Management Part 2 emphasise the use of the Cowan headway distribution for modelling. Our surveys provide the raw data to apply these refined theories accurately. This level of precision is what distinguishes a senior-led Intersection Analysis from a basic report. Queue length directly influences the Level of Service (LoS) assigned to an intersection. This grade, ranging from A to F, determines if a development’s traffic impact is considered acceptable or adverse by Council. Calibrated models allow us to perform predictive analysis, forecasting how the addition of development-generated vehicles will grow the queue over a ten-year horizon.
Impact on Car Park Design and Access
Site driveways must remain functional during peak periods. If intersection queues extend past a proposed entrance, it causes spillback and significant safety hazards. We use survey data to ensure sufficient internal queuing space is provided within the development. You can learn more about compliant car park design to see how these metrics integrate with AS 2890.1 requirements. This integration prevents road blocking and ensures the site satisfies Council access standards. By identifying the Maximum Back of Queue (MBQ) early, we can advise on driveway placement that avoids the most congested zones of the road network.
Council Compliance: Why Precise Data is Critical for DAs
Council transport planners scrutinise the Traffic Impact Assessment (TIA) to ensure development traffic does not degrade the local network. A queue length survey for intersection analysis provides the empirical baseline these planners require. Without it, council officers often flag “unrealistic” modelling as a primary reason for project refusal. We focus on providing the “ground truth” that aligns your digital model with the actual physical conditions observed by local residents and authorities.
Common red flags in a DA include modelled delays that conflict with known congestion hotspots. If a SIDRA model suggests a 20-second delay but the queue length survey for intersection analysis shows a 200-metre backup, the entire report loses credibility. This empirical data also informs the Statement of Environmental Effects. It provides the technical weight needed to justify project viability and prove that your development will not cause a gridlock. When the survey reveals existing capacity issues, we use that data to justify mitigation strategies such as signal phasing adjustments or lane upgrades.
Addressing Council RFIs (Request for Information)
Council RFIs are a significant source of project delays and increased consultancy fees. Providing empirical survey data from the outset creates a defensible position. This is particularly vital if the project reaches a Land and Environment Court appeal. The role of a traffic engineer in developments is to anticipate council objections and provide data that stands up to rigorous peer review. Planners frequently ask how peak queues affect pedestrian safety or whether they block adjacent intersections. Our reports answer these questions with site-specific measurements rather than generic estimates.
National Standards and Best Practices
Adherence to the Austroads Guide to Traffic Management is essential for survey consistency. The February 2026 update (Edition 4.0) provides the current framework for these assessments, including revised guidance on gap acceptance and headway distribution. We ensure all data is presented in a structured format that Council engineers can verify quickly. Professional certification in the final report signals that the analysis meets national regulatory standards. This meticulous approach reduces the likelihood of multiple RFI cycles and accelerates your path to approval.
Contact us today to secure a compliant Traffic Impact Assessment (TIA) Report backed by senior-level expertise and precise field data.
Professional Traffic Engineering: Precision Surveys for Planning Approvals
The methodology at ML Traffic Engineers Australia is defined by senior-level oversight at every stage of data collection. We don’t outsource critical field observations to junior staff without direct supervision. Every project is managed by senior principals who understand the specific bureaucratic requirements of local councils and state road authorities across Australia. This ensures that the survey design captures the exact metrics needed for a successful Traffic Impact Assessment.
Our “Personnel Continuity Promise” acts as a core marker of professional accountability. The same expert who organises the field survey and defines the parameters is the one who performs the technical analysis and writes the final report. This eliminates the communication gaps often found in larger firms. It ensures that the engineer defending the report before Council or a planning panel has a first-hand understanding of the site’s physical constraints and observed traffic patterns.
ML Traffic Engineers Australia provides comprehensive intersection analysis for diverse project types, from high-density residential towers to large-scale industrial subdivisions. Our integrated approach links a queue length survey for intersection analysis with other essential planning requirements, including Vehicle Swept Path Analysis and Car Park Design. This coordination ensures that your development’s access points and internal circulation are perfectly aligned with the surrounding road network’s capacity.
Why Senior Expertise Matters
Senior expertise prevents the “black box” approach where software outputs are accepted without critical professional review. While SIDRA is a powerful tool, it requires an experienced engineer to recognise when modelled results don’t match the physical reality captured in the field. We use our 15 plus years of consultancy experience to calibrate models so they reflect the actual saturation flows and driver behaviour unique to your site.
This deep-seated expertise is invaluable when negotiating with Council. We provide the empirical evidence required to challenge conservative assumptions and justify specific traffic outcomes. Explore our full range of traffic engineering services to see how we can streamline your planning approval process through meticulous data collection and authoritative reporting.
Get Started with Your Intersection Analysis
Requesting a fee proposal for an intersection survey is a straightforward process. To provide an accurate quote, we typically require a site plan, the proposed development type, and any specific requirements already issued by Council in a pre-lodgement meeting or RFI. We specialise in rapid, accurate data collection that meets all Australian Standards and local planning guidelines.
Contact ML Traffic Engineers Australia today for an authoritative traffic report and ensure your project is backed by precise, defensible intersection data.
Secure Your DA Approval with Empirical Evidence
Empirical data is the single most effective tool for overcoming Council objections and avoiding costly project delays. As discussed throughout this guide, a professional queue length survey for intersection analysis provides the “ground truth” that theoretical models often lack. By calibrating SIDRA parameters with site-specific measurements, you protect your development from the high costs of re-modelling and unnecessary RFI cycles.
ML Traffic Engineers Australia brings over 15 years of technical expertise to every project. We provide direct access to senior principals, ensuring your Traffic Impact Assessment is defensible and compliant with the latest 2026 Austroads standards. Our commitment to personnel continuity means the same expert who surveys the site writes your report, providing a level of accountability that distinguishes our consultancy from larger, more impersonal firms.
Request an Authoritative Traffic Assessment Report today to secure your planning approval with total confidence. We are ready to provide the precise data and senior-level analysis required for your next development.
Frequently Asked Questions
What is the difference between a queue length survey and a turning movement count?
A turning movement count (TMC) measures the volume and direction of vehicles passing through an intersection. A queue length survey measures the physical extent and duration of vehicle lines at each approach. While a TMC tells you how much traffic is moving, the queue survey identifies if the intersection is failing to process that volume efficiently.
How long does a typical queue length survey take to complete?
Field observations typically last between 1.5 and 2 hours during each peak period. This window covers the full morning and afternoon peak profiles to identify the busiest 15-minute interval. For complex projects, Council may require multi-day video monitoring to account for daily traffic fluctuations and ensure the data is representative of typical conditions.
Why does Council require a queue survey if I already have SIDRA results?
SIDRA is a theoretical model that relies on mathematical assumptions. Council transport planners require empirical evidence to calibrate this model against “ground truth” conditions. If your modelled results don’t match the observed field data, the Council will likely reject the Traffic Impact Assessment as unrealistic and technically flawed.
What happens if the survey shows the intersection is already over-capacity?
Identifying an over-capacity intersection early allows us to develop effective mitigation strategies. This might include proposing signal phasing adjustments, lane reconfigurations, or developer contributions toward infrastructure upgrades. Addressing these issues with hard data in the planning phase is far more cost-effective than facing a project refusal later.
Can video footage be used as a substitute for manual queue length surveys?
Yes, high-definition video analytics are a standard tool for modern data collection. Video allows for multi-day capture and provides a permanent record that senior engineers can review for quality control. Manual observations are still used for specific sites where lane occlusion or complex signal cycles make automated tracking less reliable.
How does queue spillback affect my car park design and driveway access?
Spillback occurs when intersection queues extend past your proposed site entrance, physically blocking vehicle access. This creates safety hazards and internal congestion. A precise queue length survey for intersection analysis helps determine the optimal placement for driveways and ensures sufficient internal queuing space is provided to prevent vehicles from backing up onto the public road.
Does weather affect the validity of a queue length survey for intersection analysis?
Weather significantly impacts traffic flow and driver behaviour. Heavy rain or storm events increase vehicle headways and reduce saturation flows, leading to outlier data that doesn’t reflect typical performance. We schedule surveys during fine conditions to ensure the data meets the “weather-neutral” requirements typically mandated by Australian road authorities and local councils.
How much does a professional queue length survey cost for a standard development?
Costs depend on the number of intersection approaches, the duration of the count, and the complexity of the required analysis. Fees cover site setup, data collection, and the senior-level engineering time required to verify and process the raw data. We provide tailored fee proposals that align with your specific Council requirements and the scale of your development.

Disclaimer
The content on www.mltraffic.com.au, including all technical articles, guides, and resources, is provided for general informational and educational purposes only. It is not intended to constitute professional advice in traffic engineering, transportation planning, development approvals, or any other technical or legal field.
While ML Traffic Engineers makes every reasonable effort to ensure the accuracy, completeness, and timeliness of the information published, we do not provide any warranties or representations (express or implied) regarding its reliability, suitability, or availability for any particular purpose. Any reliance you place on the content is strictly at your own risk.
In no event shall ML Traffic Engineers, its directors, employees, authors, or affiliates be liable for any direct, indirect, incidental, special, consequential, or punitive damages (including, without limitation, loss of profits, data, or business opportunities) arising out of or in connection with the use of, or inability to use, any information provided on this website.
The articles and guides on this site are not a substitute for engaging a qualified, registered professional traffic engineer (such as an NPER or RPEQ engineer) to assess your specific project requirements. For tailored advice, compliance assessments, or traffic engineering services, please contact a competent professional.
This disclaimer may be updated from time to time without notice. By accessing or using this website, you agree to be bound by the most current version of this disclaimer.
