

A single technical oversight in your Traffic Impact Assessment (TIA) can stall a multi-million dollar development application for months. You’ve likely felt the frustration of deciphering dense SIDRA outputs or the fear that a misunderstood v/c ratio might lead to an immediate DA rejection. It’s a common challenge; the technical indicators required by Australian councils are complex and unforgiving. This article clarifies the key metrics in an intersection performance report, transforming confusing data into a strategic tool for project approval.
You’ll gain a direct understanding of how to interpret Level of Service (LoS), degree of saturation, and queue lengths to satisfy regulatory requirements. We’ll reference the latest standards, including SIDRA INTERSECTION 11.0, released in March 2026, and the Highway Capacity Manual 7th Edition (HCM 2022). This guide ensures your traffic data is both current and compliant. By mastering these indicators, you can optimize your site access design and move your project through the planning phase with professional confidence.
Key Takeaways
- Understand why intersection analysis is a mandatory component of a Traffic Impact Assessment to validate site access viability.
- Master the key metrics in an intersection performance report, including Degree of Saturation and Level of Service, to assess road capacity accurately.
- Evaluate advanced indicators like Average Delay and 95th Percentile Queue Length to ensure your development doesn’t block existing traffic flow.
- Interpret SIDRA INTERSECTION outputs to verify that proposed intersection geometry and signal timings meet Australian regulatory standards.
- Learn to leverage technical performance data to mitigate Council objections and secure Development Application approval with expert evidence.
The Role of Intersection Performance in Traffic Impact Assessments
Every Traffic Impact Assessment (TIA) hinges on the available capacity of the surrounding road infrastructure. An Intersection Analysis isn’t a secondary check. It’s the core evidence required to prove a development won’t cripple local traffic flow. Councils scrutinize key metrics in an intersection performance report to determine if your site access design integrates safely with the existing network. If the data shows a significant drop in the Level of Service (LOS), you’ll likely face mandatory infrastructure upgrades or reduced development density.
Local authorities use these performance reports to calculate developer contributions. They compare baseline traffic data against post-development projected volumes to isolate the specific impact of your project. This prevents existing congestion from being unfairly attributed to new developments. It also ensures developers pay for the exact capacity they consume. Accurate modeling protects you from over-contributing to regional infrastructure funds while ensuring your DA meets technical requirements.
To better understand how technical indicators function as key performance markers, watch this deep dive into metric analysis:
Interpreting the key metrics in an intersection performance report requires a shift from manual review to corridor-level management. Modern assessments now incorporate “digital twins” to simulate complex traffic scenarios. These virtual models allow us to test how your development performs during routine hours and extreme events. By using real-time performance measurement tools and 2026-compliant data sets, we provide councils with data-driven proof of site viability. This includes accounting for the latest version of modeling software like SIDRA INTERSECTION 11.0, released on March 25, 2026.
Regulatory Framework: Austroads and Local Council Requirements
Adherence to the Austroads Guide to Traffic Management provides a national standard for consistency. However, local councils often set stricter performance thresholds based on specific urban density targets. A report must satisfy both national guidelines and local jurisdiction requirements to pass technical review. We reference the Highway Capacity Manual 7th Edition (HCM 2022) alongside Austroads standards to ensure every technical indicator stands up to legal scrutiny. This dual-layered approach is essential for long-term urban planning compliance.
Determining the Study Area and Scope of Analysis
Identifying which intersections require analysis is a strategic decision. The study area usually includes all signalised and priority intersections where the development adds more than 5% to the existing base traffic. Analysis must cover both AM and PM peak periods to capture the absolute worst-case scenario for road network stress. Scope definition prevents unnecessary costs. We focus on intersections where development traffic significantly alters the degree of saturation, ensuring the analysis remains targeted and persuasive for planning authorities.
Primary Metrics: Capacity, Volume, and Level of Service
The core of any traffic assessment lies in three fundamental pillars: how much traffic a road can hold, how much is actually there, and the resulting driver experience. These key metrics in an intersection performance report provide a snapshot of current and future network health. Engineers use these data points to determine if a development’s additional traffic load will push an intersection beyond its physical limits. Without these metrics, a planning application lacks the technical evidence required for council approval.
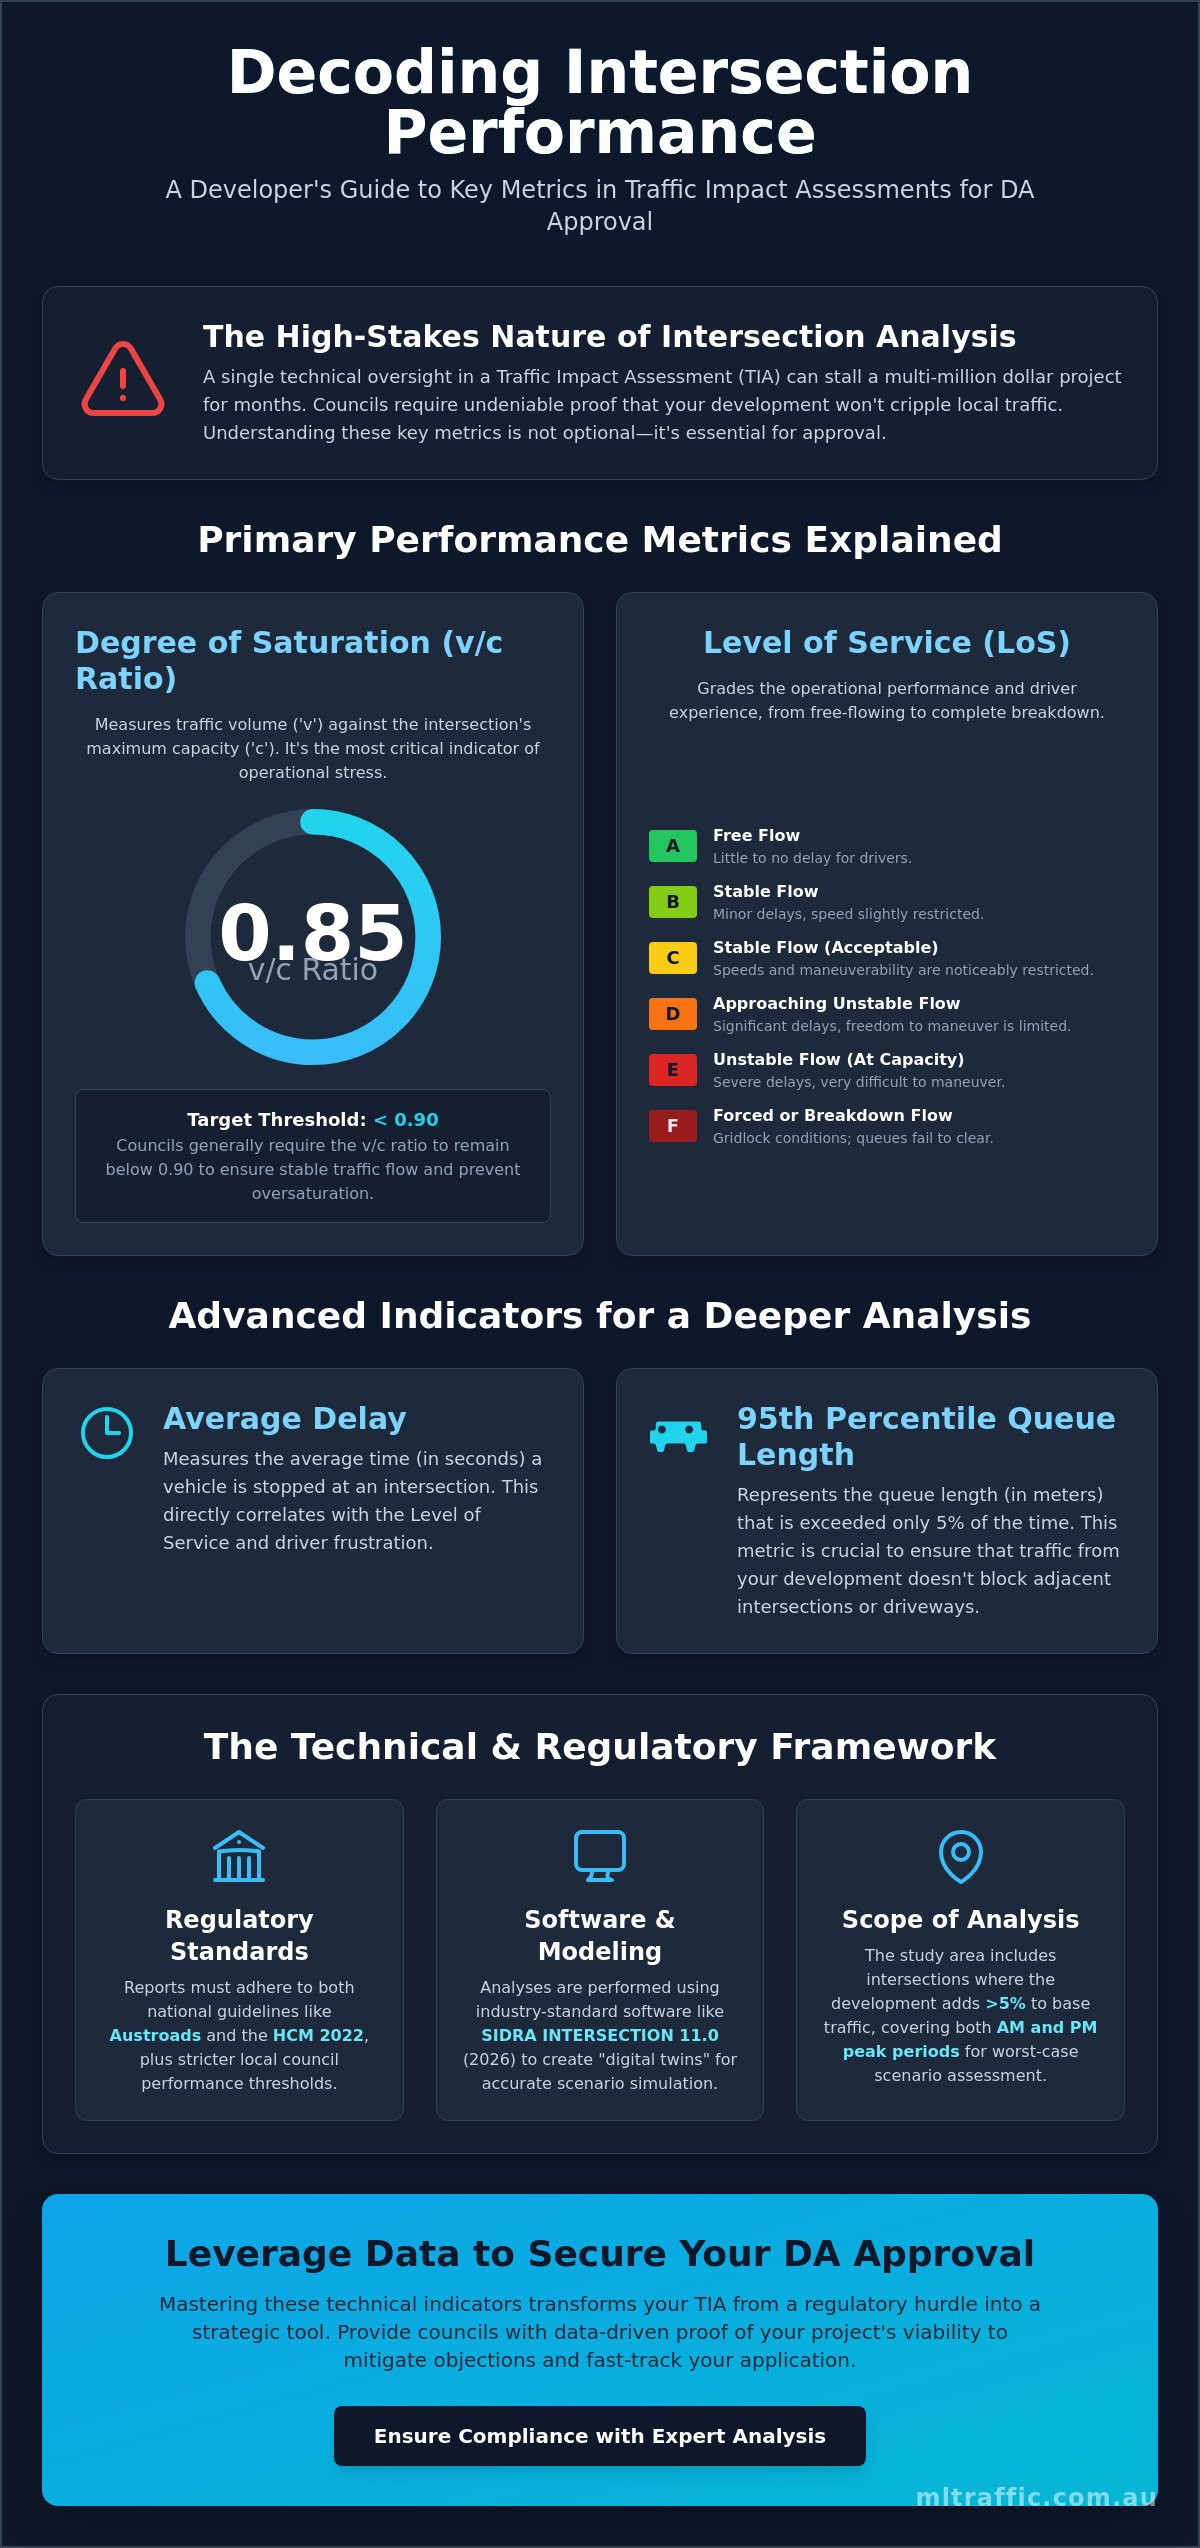
Degree of Saturation (v/c ratio) measures the utilization of available road space. It’s a critical technical indicator. While theoretical capacity represents the absolute maximum number of vehicles a lane can accommodate, practical design targets are significantly lower. Designing for 100% saturation is dangerous. It leaves no room for fluctuations or driver error. Instead, we look at Intersection-Level Performance Measures to ensure the network remains stable under pressure. Peak Flow Factors (PFF) are also applied to account for short-term surges within the peak hour, typically measuring 15-minute intervals to capture the most intense periods of demand.
Interpreting the Level of Service (LoS) Grade
The Level of Service (LoS) uses an A to F grading system to describe operational conditions. Grades A through C represent optimal conditions where drivers experience minimal delay. Most Australian councils require new developments to maintain at least an LoS C or D. LoS D is often the “acceptable” threshold in high-density urban areas. However, once an intersection hits LoS E or F, it’s considered to be failing. These grades trigger mandatory mitigation strategies, such as signal retiming or physical lane expansions, to restore functionality.
Volume-to-Capacity (v/c) Ratio Thresholds
A v/c ratio exceeding 0.90 is a major red flag. In most jurisdictions, hitting this threshold triggers an immediate requirement for intersection redesign. We distinguish between approach capacity and lane group capacity to identify specific bottlenecks. For example, a left-turn lane might be failing while the through-lanes remain clear. Balancing these volume increases often requires a detailed swept path analysis to ensure that larger vehicles can still navigate the intersection safely after any proposed geometric changes. If your current report shows high saturation levels, you should seek expert intersection analysis to explore viable mitigation options before submitting your DA.
Compliance with Australian Standard AS 2890 is also essential when assessing these key metrics in an intersection performance report. This standard governs off-street parking and driveway access, which directly impacts how traffic enters and exits the main road network. Ensuring your site access points align with both AS 2890 and the modeled intersection capacity is vital for a successful application.
Advanced Indicators: Delay, Queuing, and Progression
Advanced indicators move beyond simple pass/fail grades to provide a forensic look at traffic flow. These key metrics in an intersection performance report, specifically Average Delay, queuing, and reliability, dictate the physical design requirements of your project. While the Level of Service (LoS) provides a qualitative grade, Average Delay quantifies the actual time lost per vehicle in seconds. Councils use this data to assess the economic and environmental impact of a development. A high stop rate, for instance, correlates directly with increased fuel consumption and emissions, which may conflict with local sustainability targets.
Travel time reliability is another critical factor. It measures the consistency of traffic flow rather than just raw speed. For developers, proving that a project won’t introduce unpredictable delays is often more persuasive than showing high speeds. These metrics are calculated using the latest software capabilities. For example, SIDRA INTERSECTION 11.0, released in March 2026, includes updated cost parameters for fuel and emissions, allowing for a more accurate assessment of the environmental costs associated with vehicle stops and delays.
Queue Length Analysis and Site Access
Preventing gridlock requires a precise calculation of the 95th percentile queue. This represents the queue length that will not be exceeded 95% of the time during the peak period. If this queue extends past your proposed site access, vehicles will be unable to enter or exit the property, leading to total operational failure. This analysis is inextricably linked to effective car park design. Entry points must be positioned beyond the influence of these queues to ensure functionality. Common mitigation strategies include extending turn lanes or increasing storage capacity to prevent “spillback” into adjacent intersections.
Signal Coordination and Platoon Ratios
Signal coordination is evaluated through platoon ratios and the implementation of “Green Waves.” A high platoon ratio indicates that vehicles are arriving at the intersection in a consolidated group during the green phase. This reduces the stop rate and improves average delay across the entire corridor. When a key metrics in an intersection performance report demonstrates effective coordination, it shows that the development integrates into a managed network. This reduces the likelihood of downstream congestion and ensures that your site access does not disrupt the established rhythm of the surrounding road network.
Our approach ensures that these technical indicators are not just numbers on a page. We translate this data into a compliant Intersection Analysis that addresses specific council concerns regarding congestion and safety. By focusing on 95th percentile queues and travel time reliability, we provide the evidence-based framework necessary to secure your development application approval.
Standard Software and Output Interpretation: SIDRA INTERSECTION
SIDRA INTERSECTION is the mandatory modeling platform for Australian traffic engineering. It provides the mathematical foundation for the key metrics in an intersection performance report. The latest release, SIDRA INTERSECTION 11.0 on March 25, 2026, introduced the SIDRA ASSIGN module and enhanced network convergence methods. These updates allow for more precise modeling of how drivers choose routes within a network. The software requires high-fidelity inputs, including lane geometry, precise signal timings for signalised sites, and current traffic counts.
A standard report distinguishes between “Movement” and “Intersection” summaries. While the intersection summary provides a weighted average, the movement summary is where bottlenecks are identified. Councils focus on the worst-performing movement rather than the overall average. For complex corridor interactions where intersections are closely spaced, microsimulation may be required to supplement SIDRA data. This ensures that the interaction between adjacent signals is captured accurately and reflects real-world conditions.
Reading a SIDRA Performance Summary
The “Worst Movement” is the primary indicator of a potential bottleneck. Even if an intersection has an overall LoS B, a single movement at LoS F can lead to a DA rejection. At unsignalised intersections, we verify gap-acceptance parameters to ensure vehicles can safely enter the traffic stream without causing safety hazards. Another critical output is “Practical Spare Capacity.” This metric tells councils how much additional traffic the intersection can handle before it hits the 90% saturation threshold. Identifying these key metrics in an intersection performance report allows for targeted infrastructure improvements.
Sensitivity Testing and Future Scenarios
Councils do not just look at day-one impacts. They require modeling for a 10-year growth forecast, typically looking ahead to 2036 and beyond. This sensitivity testing involves several critical steps:
- Establishing a “Base Case” model that includes existing traffic plus regional growth.
- Developing a “With Development” model to isolate the specific impact of the proposed project.
- Conducting scenario testing where traffic volumes are increased by 10% or 20% to account for unforeseen local growth.
This rigorous testing proves that your site access remains viable long after the project is completed. If you require a compliant modeling report that survives technical scrutiny, book a professional Intersection Analysis to ensure your data meets current regulatory standards.
Securing DA Approval through Professional Intersection Analysis
Securing a Development Application (DA) approval requires more than just generating a SIDRA output. You’ve got to translate the key metrics in an intersection performance report into a clear, evidence-based planning argument. Councils often raise objections based on perceived traffic congestion or safety risks. A professional report anticipates these concerns. It demonstrates that the proposed development maintains acceptable Level of Service (LoS) thresholds. We show that the degree of saturation remains within manageable limits, even under peak demand. This proactive approach prevents the bureaucracy from stalling your project.
High-stakes negotiations with planning authorities often hinge on how technical indicators are interpreted. This is where senior-led consultancy provides significant value. We don’t just provide raw data; we provide actionable recommendations for site access optimization. This might include signal retiming or minor geometric adjustments to ensure the intersection functions effectively. Our final reports are designed for clarity and compliance. This ensures that council traffic engineers can verify the findings without unnecessary back-and-forth. We use the most current standards, including the Highway Capacity Manual 7th Edition (HCM 2022), to ensure every argument is technically sound.
Common Pitfalls in Intersection Reporting
Many developers face delays because they underestimate the impact of heavy vehicles. A standard key metrics in an intersection performance report must be supported by accurate swept path requirements. This ensures service vehicles can navigate the site safely without disrupting flow. Another common error is failing to account for nearby planned developments. Councils require a cumulative impact assessment. This considers all approved but not yet constructed projects in the study area. Inconsistencies between the Traffic Impact Assessment and the Statement of Environmental Effects can also lead to immediate rejection. We eliminate these risks through meticulous data cross-referencing.
The ML Traffic Advantage: Direct Access to Senior Expertise
We offer a distinct advantage through direct access to senior expertise. The same expert who initiates your project performs the technical work. This personnel continuity promise ensures consistency throughout the DA process. It distinguishes us from larger, impersonal firms where work is often delegated to junior staff. With a 15-year history of securing approvals across Australia, we understand the specific requirements of local jurisdictions. We utilize the most current methodologies, including SIDRA INTERSECTION 11.0, released on March 25, 2026. If you require a compliant Intersection Analysis that stands up to scrutiny, contact our senior principals for a project-specific fee proposal.
Securing DA Success with Technical Precision
Mastering the key metrics in an intersection performance report is the most effective way to mitigate Council objections and ensure your development application proceeds without delay. You’ve learned how Level of Service, degree of saturation, and 95th percentile queue lengths serve as the evidence-based framework for site access viability. By utilizing SIDRA INTERSECTION 11.0 and adhering to HCM 2022 standards, you provide planning authorities with the technical certainty they require.
Successful DA outcomes depend on professional interpretation and senior-led negotiation. With over 15 years of Australian traffic engineering experience, our team specializes in translating complex data into compliant reports that pass regulatory scrutiny. You’ll work directly with our senior principals; this ensures total accountability and technical excellence from initiation to final submission. Don’t risk a rejection due to inadequate modeling or misinterpreted data. Get a compliant Intersection Performance Report for your project today. We look forward to helping you optimize your site design and secure your approval.
Frequently Asked Questions
What is the most important metric in an intersection performance report?
The Degree of Saturation (v/c ratio) is widely considered the most critical indicator. It measures the utilization of available road space and determines if an intersection is physically capable of handling projected traffic volumes. This is one of the key metrics in an intersection performance report that councils prioritize because it identifies immediate capacity failures and the need for infrastructure upgrades.
How does Level of Service (LoS) affect my development application?
Level of Service (LoS) provides a qualitative grade from A to F that describes driver experience and delay. Most Australian councils set a minimum threshold of LoS D for urban developments. If your project causes an intersection to drop to LoS E or F, the council will likely require mitigation measures or reduce your development’s allowable density to maintain network functionality.
Why do councils require 95th percentile queue length data?
Councils use 95th percentile queue length data to prevent gridlock and ensure that traffic doesn’t spill back into upstream intersections. This metric represents a near-worst-case scenario that is only exceeded 5% of the time during peak periods. It’s essential for verifying that your site access points remain clear and that turning lanes have sufficient storage capacity to accommodate arriving vehicles safely.
Can a development be approved if the intersection LoS is F?
Approval for a project with an intersection at LoS F is rare without significant intervention. Since LoS F indicates total operational failure, developers must typically propose and fund infrastructure upgrades, such as lane expansions or signal installations, to return the intersection to an acceptable grade. Councils require data-driven proof that these improvements will effectively mitigate the development’s specific traffic impact.
What software is used for intersection performance modelling in Australia?
SIDRA INTERSECTION is the industry standard software used across Australia for traffic modeling. The current version, SIDRA INTERSECTION 11.0, was released on March 25, 2026. It’s used to generate the key metrics in an intersection performance report by analyzing complex lane geometries, signal timings, and gap acceptance for both signalised and unsignalised intersections within the road network.
How far into the future must an intersection report forecast traffic?
Intersection reports typically must forecast traffic conditions 10 years beyond the project’s anticipated completion date. This long-term modeling ensures the road network can accommodate both the development’s traffic and regional growth over a decade. For projects analyzed in 2026, this usually involves creating sensitivity models for the year 2036 to satisfy council requirements for sustainable urban planning.
What is the difference between a signalised and unsignalised intersection report?
A signalised intersection report focuses on phase timings, cycle lengths, and coordination between signals to manage flow. In contrast, an unsignalised report emphasizes gap acceptance and the ability of vehicles to safely enter the main traffic stream from side roads or driveways. Both report types utilize specific technical indicators to prove that the chosen intersection control method is appropriate for the projected volumes.
How much does a professional intersection performance report cost?
The cost of a professional report depends on the number of intersections analyzed and the complexity of the modeling required. Factors such as the need for microsimulation or extensive 10-year growth forecasting will influence the final fee. Developers should seek a project-specific fee proposal from a qualified traffic engineering firm to ensure all council-mandated technical requirements are covered in the scope of work.

Article by
Michael Lee
Practising traffic engineer with over 35 years experience.
Disclaimer
The content on www.mltraffic.com.au, including all technical articles, guides, and resources, is provided for general informational and educational purposes only. It is not intended to constitute professional advice in traffic engineering, transportation planning, development approvals, or any other technical or legal field.
While ML Traffic Engineers makes every reasonable effort to ensure the accuracy, completeness, and timeliness of the information published, we do not provide any warranties or representations (express or implied) regarding its reliability, suitability, or availability for any particular purpose. Any reliance you place on the content is strictly at your own risk.
In no event shall ML Traffic Engineers, its directors, employees, authors, or affiliates be liable for any direct, indirect, incidental, special, consequential, or punitive damages (including, without limitation, loss of profits, data, or business opportunities) arising out of or in connection with the use of, or inability to use, any information provided on this website.
The articles and guides on this site are not a substitute for engaging a qualified, registered professional traffic engineer (such as an NPER or RPEQ engineer) to assess your specific project requirements. For tailored advice, compliance assessments, or traffic engineering services, please contact a competent professional.
This disclaimer may be updated from time to time without notice. By accessing or using this website, you agree to be bound by the most current version of this disclaimer.
