

Every unnecessary basement car park level adds millions to your construction budget and months to your approval timeline. You likely recognise that rigid parking requirements often fail to account for a site’s actual connectivity, leading to protracted disputes with council over traffic generation and infrastructure contributions. Navigating the nuances of different state-based metrics while trying to maintain project viability is a significant technical burden for any Australian developer.
By accurately assessing public transport accessibility score, you can provide the rigorous evidence required to justify parking waivers or reductions. This guide explains how to calculate and leverage these scores to streamline council approvals and optimise your development’s parking layout. We provide a clear breakdown of the PTAL methodology, the implications of recent Victoria Planning Provision changes like Amendment VC277, and the specific data sets required to satisfy Transport for NSW or other state authorities. You will learn how to transform raw accessibility data into a strategic asset that secures faster DA outcomes with fewer RFI cycles.
Key Takeaways
- Understand the functional differences between PTAL and Movement and Place frameworks to ensure your site assessment aligns with state-specific planning requirements.
- Discover how assessing public transport accessibility score with site-specific data can justify significant reductions in mandatory car parking provisions.
- Learn why bespoke technical assessments are essential for identifying connectivity advantages that generic council mapping often overlooks.
- Identify the direct financial benefits of high accessibility scores, including reduced basement excavation costs and increased total site yield.
- Ensure technical accuracy and reduce RFI cycles by engaging experienced traffic engineers who manage the reporting process from data collection to DA submission.
What is a Public Transport Accessibility Score in Australian Planning?
In Australian urban planning, an accessibility score is a quantitative value that represents how effectively a specific land parcel connects to the broader public transport network. Historically, development assessments focused almost exclusively on road capacity and car parking supply. State governments have now transitioned toward ‘place-based’ frameworks that prioritise transit-oriented development. Assessing public transport accessibility score is a standard requirement for high-density residential and commercial Development Applications (DAs), as it provides the technical justification for lower traffic generation rates.
This metric bridges the gap between land use and transport infrastructure. It acknowledges that a site with high connectivity requires fewer private vehicle trips, which directly reduces the infrastructure burden on the local council. Recent regulatory changes, reflecting an evolving focus on sustainable urban development, have formalised this relationship. These scores are now mandatory for many developments to determine both minimum and maximum car parking provisions.
The Core Components of an Accessibility Score
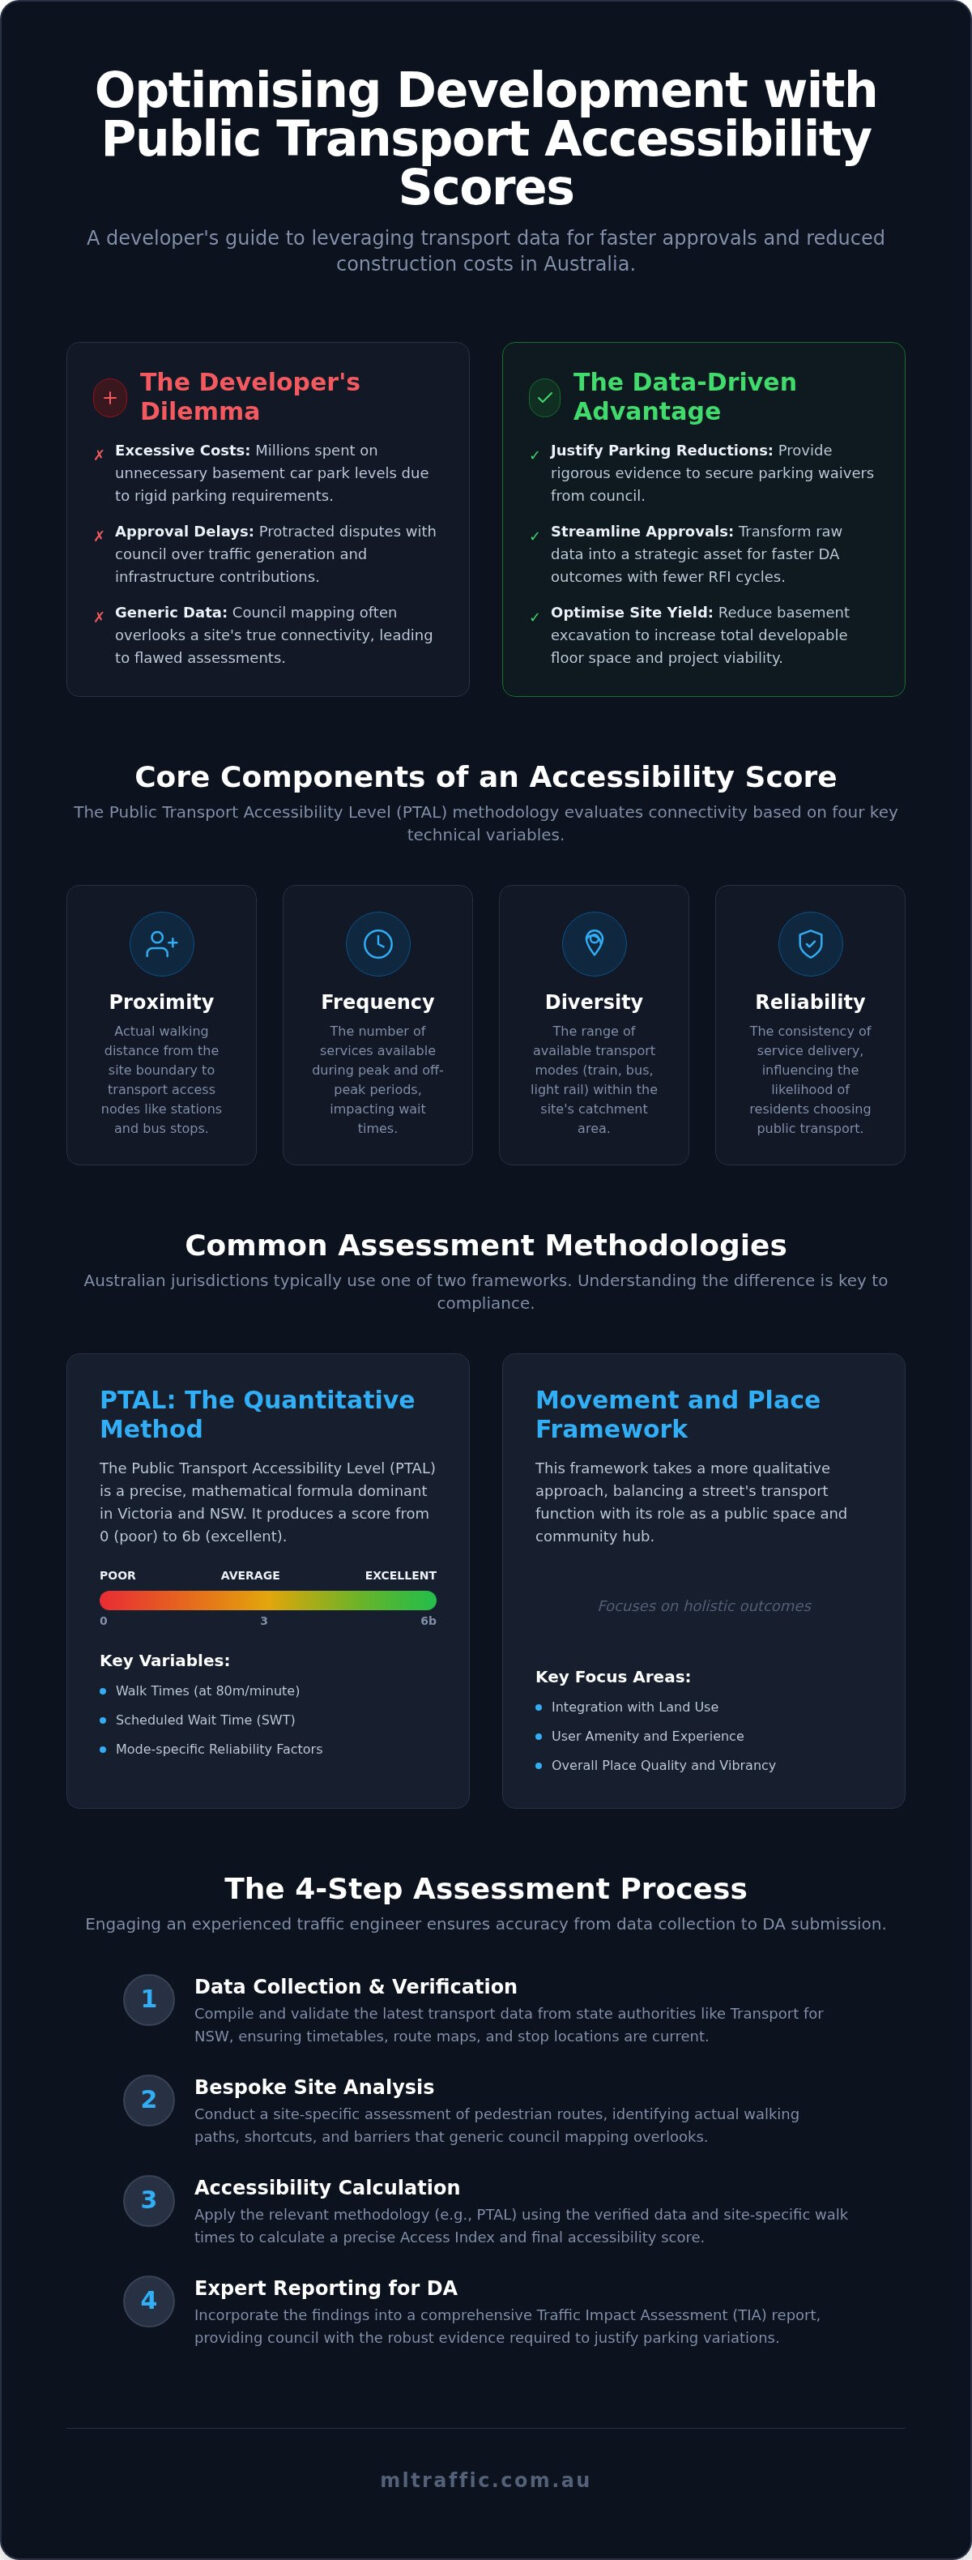
The most widely adopted methodology for this calculation is the Public Transport Accessibility Level (PTAL). This system, used extensively in London and now across Victoria and New South Wales, evaluates connectivity based on several technical variables:
- Proximity: The actual walking distance from the site boundary to ‘Access Nodes’, such as train stations, bus stops, or light rail platforms.
- Frequency: The number of services available during peak hour windows and off-peak periods.
- Diversity: The range of transport modes available within a defined catchment, which increases the resilience of the site’s transport options.
- Reliability: The consistency of service delivery, which influences the likelihood of residents or employees choosing transit over private vehicles.
Why Accessibility Matters for Your DA
A high accessibility score is a strategic asset for any developer. It allows for a factual departure from standard car parking rates, which often impose excessive construction costs for underground parking. If you can prove a site has superior connectivity, you can often secure a parking waiver or reduction.
Assessing public transport accessibility score provides the evidence base for your Traffic Impact Assessment (TIA) report. It demonstrates that the development will not place undue pressure on the local road network. This data is essential for meeting local council ‘Transport Choice’ objectives and can be used to justify higher Floor Space Ratios (FSR) in transit-oriented zones. Without a professional assessment, you risk being held to generic parking rates that do not reflect the reality of your site’s location.
Common Methodologies: PTAL vs. Movement and Place Indicators
Australian jurisdictions generally adopt one of two primary frameworks for evaluating transit connectivity. The choice of methodology depends on the specific state planning provisions and the local council’s technical requirements. While both systems aim to quantify connectivity, they differ in their mathematical rigour and qualitative focus. Effectively assessing public transport accessibility score requires understanding which framework applies to your specific site and how the underlying data is weighted.
Understanding the PTAL Calculation
The Public Transport Accessibility Level (PTAL) is the dominant methodology in Victoria and is increasingly used for technical assessments in New South Wales. It relies on a precise mathematical formula to produce an Access Index (AI). This index is converted into a score from 0 to 6b, where 6b represents the highest level of connectivity. The calculation involves several fixed variables:
- Walk Times: Calculated from the site to the Access Node using a standardised walking speed of 80 metres per minute.
- Scheduled Waiting Time (SWT): Defined as half the headway (the time between services) during the peak hour.
- Reliability Factor: A mode-specific constant added to the SWT to account for typical delays, such as two minutes for bus services.
- Total Access Time: The sum of the walk time, SWT, and the reliability factor.
The resulting Access Index for each mode is aggregated to determine the final site score. High-frequency rail services carry more weight than infrequent bus routes, reflecting their higher capacity and perceived reliability for commuters.
Movement and Place Indicators
New South Wales and Queensland have shifted toward the Movement and Place framework. This approach is less about a single numerical score and more about ‘Built Environment Indicators’. It evaluates how the transport network functions as both a corridor for movement and a destination for people. Accessibility is weighted against pedestrian comfort, safety, and the quality of the public realm. In these assessments, developers must often integrate accessibility data with a Green Travel Plan to demonstrate how they will actively discourage private vehicle use.
Other regions are following this trend. The Australian Capital Territory introduced new Transport Impact Assessment Guidelines in July 2025, which include a dedicated Movement and Place Assessment Tool. Static government maps provide a useful baseline, but they often fail to account for recent service upgrades or local pedestrian barriers. For example, the latest TfNSW PTAL datasets were updated in June 2026, yet they may not reflect very recent changes to local bus headways. Our team at ML Traffic Engineers conducts site-specific verifications to ensure your DA is based on current network conditions rather than outdated government mapping.
The Process of Assessing Public Transport Accessibility for Your Site
Relying on generic council maps for a Development Application is a high-risk strategy. These maps often use broad datasets that fail to capture recent service changes or specific site advantages. A bespoke assessment performed by a traffic engineer provides a precise, defensible record of connectivity. The process of assessing public transport accessibility score involves three technical stages to ensure the final report withstands council scrutiny and supports your parking requirements.
Step 1: Catchment Area Mapping
The first stage involves identifying all transport nodes within a defined radius, typically 800 metres for train stations and 400 metres for bus or light rail stops. We use Geographic Information System (GIS) software to map actual walking paths. This method accounts for physical barriers like fences, steep gradients, or lack of pedestrian crossings, rather than measuring distance ‘as the crow flies’. Isochrone mapping is used as a technical tool for visualising travel time catchments by showing the area reachable within a specific timeframe. This provides a realistic view of how residents or employees will actually move through the local environment, effectively addressing ‘last mile’ connectivity issues.
Step 2: Service Frequency Analysis
A high-quality assessment requires a detailed audit of current timetables across all available modes. We analyse service levels during ‘Peak Period’ windows, typically 7:00 am to 9:00 am and 4:00 pm to 6:00 pm, as well as ‘Inter-peak’ frequencies. This analysis is critical because a nearby bus stop with only one service per hour does not provide a genuine alternative to car ownership. We also account for committed future infrastructure, such as the Sydney Metro extensions or the Suburban Rail Loop in Melbourne. Including these upgrades in the assessment demonstrates the long-term viability of the development’s transit-oriented design.
Step 3: Calculating the Accessibility Index
The final stage is applying the specific state or local formula to reach a definitive score. This involves synthesising proximity, frequency, and reliability into a single index. We then compare this score against regional benchmarks to determine if the site qualifies as ‘high’ or ‘very high’ accessibility. The results are synthesised into a formal Accessibility Statement. This document becomes a cornerstone of your Traffic Impact Assessment. It provides the factual basis for justifying parking reductions and ensures your DA submission is technically robust.
Leveraging Accessibility Scores to Optimise Parking and Site Yield
High accessibility scores are not merely compliance markers. They serve as powerful evidence to negotiate a reduction in car parking rates. Traditional planning schemes often require a fixed number of spaces per dwelling or square metre of commercial space. These rates frequently overestimate actual demand in transit-rich corridors. By assessing public transport accessibility score, you provide a technical basis to depart from these rigid standards and align your project with actual transport behaviour.
Reducing car parking has a profound financial impact. A single basement parking level often adds significant costs to a project’s feasibility. Eliminating a full basement level through a successful parking waiver can save millions in excavation and structural costs. It also reduces the project’s risk profile by shortening the construction timeline and reducing the complexity of the build. Addressing the ‘Traffic Generation’ objection becomes straightforward when data shows that high accessibility equals fewer private vehicle trips.
Justifying Parking Reductions under AS 2890.1
Australian Standard AS 2890.1 provides the framework for off-street parking facilities. However, it does not account for the specific transit connectivity of every unique site. We use the accessibility score to prove that the actual demand for parking is lower than the statutory minimums. Professional Car Parking Demand Assessments incorporate accessibility as a primary variable. We have managed numerous cases where high-scoring commercial developments achieved a zero-parking requirement. This is possible when the assessment demonstrates that employees and visitors have reliable, high-frequency alternatives to private vehicle travel.
Maximising Developable Area
Optimising your parking layout directly increases the total site yield. Every square metre saved from a car park is a square metre that can be repurposed for additional apartments or commercial floor space. This improves the project’s Floor Space Ratio (FSR) and overall profitability. Beyond financial yield, reducing parking improves the ‘Place’ value of the development. It allows for more active street frontages and better pedestrian amenities by minimising the width and frequency of driveway crossovers. Assessing public transport accessibility score is the first step in unlocking this additional value.
In high-accessibility zones, we often recommend ‘Unbundled Parking’. This strategy separates the cost of the parking space from the cost of the dwelling or commercial lease. Residents who do not own a car are not forced to pay for a space they don’t use. This approach is highly favoured by councils aiming to reduce traffic generation and promote sustainable urban growth. To secure these benefits for your next project, book a consultation with our technical team today.
Engaging a Traffic Engineer for Accurate Accessibility Reporting
Submitting a Development Application with inaccurate or ‘self-assessed’ accessibility data creates significant regulatory risk. Council planning officers and transport departments use sophisticated modelling to verify claims. If your data’s found to be outdated or technically flawed, it leads to immediate Requests for Information (RFI) or a flat rejection of parking waiver requests. Assessing public transport accessibility score requires a high degree of technical precision to ensure the findings are defensible during council negotiations or in the Land and Environment Court.
At ML Traffic Engineers, we provide a direct, no-nonsense approach to technical reporting. We don’t just provide raw data; we provide defensible evidence that withstands council scrutiny. A core signature of our consultancy is our personnel continuity promise. The senior expert who initiates your project and performs the initial site assessment is the same professional who completes the technical work and defends the report. This avoids the communication breakdowns often found in larger, more impersonal firms where junior staff frequently handle the data processing.
The Value of Professional Traffic Engineering
Navigating council objections regarding traffic generation requires authoritative, evidence-based data. Our expertise extends beyond accessibility scores to include integrated services such as Swept Path Analysis and site access design. By providing a comprehensive Traffic Impact Assessment that links high accessibility to reduced parking demand, we significantly lower the likelihood of costly DA delays. Our reports are meticulous and results-oriented, providing the reliability required for complex urban developments across Australia.
Next Steps for Your Project
Engaging a traffic engineer during the early feasibility stage is the most effective way to optimise your site’s potential. Identifying a high accessibility score early allows you to design your basement and floor plates around realistic parking requirements rather than statutory maximums. This proactive approach prevents the need for expensive redesigns later in the planning process. To provide an accurate quote for your assessment, we require a current site plan and specific land use details. Contact ML Traffic Engineers to discuss your site’s accessibility potential and ensure your technical reporting is robust enough for DA approval.
Unlocking Site Potential Through Technical Compliance
A high public transport accessibility score is a strategic asset that directly influences your project’s financial feasibility. By moving beyond generic council mapping and accurately assessing public transport accessibility score, you provide a factual basis for parking reductions. This data justifies lower traffic generation rates and reduces the requirement for expensive basement parking levels. These technical insights allow you to maximise developable area while ensuring full compliance with local planning schemes.
ML Traffic Engineers provides the technical expertise needed to navigate complex council negotiations. With over 15 years of national experience, we are specialists in council compliance and AS 2890.1 parking standards. Our firm ensures direct access to senior principals. The expert who starts your assessment is the one who finishes it. This hands-on approach minimises RFI cycles and accelerates your approval timeline.
Secure your DA approval with a professional Traffic Impact Assessment from ML Traffic Engineers. We look forward to optimising your next development project.
Frequently Asked Questions
What is a good public transport accessibility score for a new development?
A PTAL score of 4 or higher is generally considered ‘Good’ to ‘Excellent’ and serves as a strong benchmark for justifying parking reductions. High scores indicate frequent services and short walk times to multiple transport modes. Sites achieving scores of 5 or 6 provide the most compelling technical basis for significant parking waivers in metropolitan areas across Australia.
Can an accessibility score be used to reduce visitor parking requirements?
Yes, a high accessibility score supports the technical argument that visitors are more likely to utilise transit than private vehicles. While resident parking is the primary focus of most assessments, demonstrating high connectivity allows traffic engineers to justify lower visitor parking rates within a Car Parking Demand Assessment. This is particularly effective for commercial developments in transit-oriented zones.
How often are the government accessibility maps updated?
Update frequencies vary by state jurisdiction. For instance, Transport for NSW released updated PTAL datasets in June 2026, while Victorian datasets were updated in July 2026. Because these maps are updated periodically, they may miss very recent service changes. Assessing public transport accessibility score with current timetable data ensures your report is technically robust and reflects real-world conditions.
What happens if my site has a low score but is near a future planned train station?
Future infrastructure can be included as a qualitative factor in your Traffic Impact Assessment. While current scores rely on existing services, we can argue for a provisional reduction based on committed projects like the Suburban Rail Loop or Metro extensions. This requires detailed evidence of the project’s construction timeline and its specific impact on the site’s future connectivity.
Does a high accessibility score affect the results of a Swept Path Analysis?
No, the accessibility score and Swept Path Analysis are independent technical requirements. A high score may reduce the total number of vehicles entering the site, but it does not change the physical dimensions required for a vehicle to navigate a driveway safely. Both assessments must comply with AS 2890.1 parking standards regardless of how close the site is to public transport.
Is a Green Travel Plan required if I have a high accessibility score?
Many councils mandate a Green Travel Plan (GTP) as a condition of consent for high-accessibility developments. The accessibility score proves the infrastructure exists, while the GTP outlines the operational strategies to encourage its use. These strategies often include unbundled parking, bicycle end-of-trip facilities, and transit subsidies for employees or residents to ensure the development meets sustainability objectives.
How much does a formal public transport accessibility assessment cost?
Costs vary based on the project’s scale and the complexity of the local transport network. We do not provide fixed pricing without reviewing a specific site plan and land use details. Engaging a professional early in the feasibility stage ensures the assessment is integrated into your broader Traffic Impact Assessment, providing the highest value and reducing the risk of expensive redesign costs.
Can I use accessibility scores for regional Australian projects?
Yes, assessing public transport accessibility score is increasingly relevant for regional hubs with established bus or rail networks. While regional scores are typically lower than metropolitan averages, the methodology still provides a factual basis for comparing a site’s connectivity against local benchmarks. This is essential for large-scale regional residential developments or commercial centres located near transport interchanges.

Disclaimer
The content on www.mltraffic.com.au, including all technical articles, guides, and resources, is provided for general informational and educational purposes only. It is not intended to constitute professional advice in traffic engineering, transportation planning, development approvals, or any other technical or legal field.
While ML Traffic Engineers makes every reasonable effort to ensure the accuracy, completeness, and timeliness of the information published, we do not provide any warranties or representations (express or implied) regarding its reliability, suitability, or availability for any particular purpose. Any reliance you place on the content is strictly at your own risk.
In no event shall ML Traffic Engineers, its directors, employees, authors, or affiliates be liable for any direct, indirect, incidental, special, consequential, or punitive damages (including, without limitation, loss of profits, data, or business opportunities) arising out of or in connection with the use of, or inability to use, any information provided on this website.
The articles and guides on this site are not a substitute for engaging a qualified, registered professional traffic engineer (such as an NPER or RPEQ engineer) to assess your specific project requirements. For tailored advice, compliance assessments, or traffic engineering services, please contact a competent professional.
This disclaimer may be updated from time to time without notice. By accessing or using this website, you agree to be bound by the most current version of this disclaimer.
