

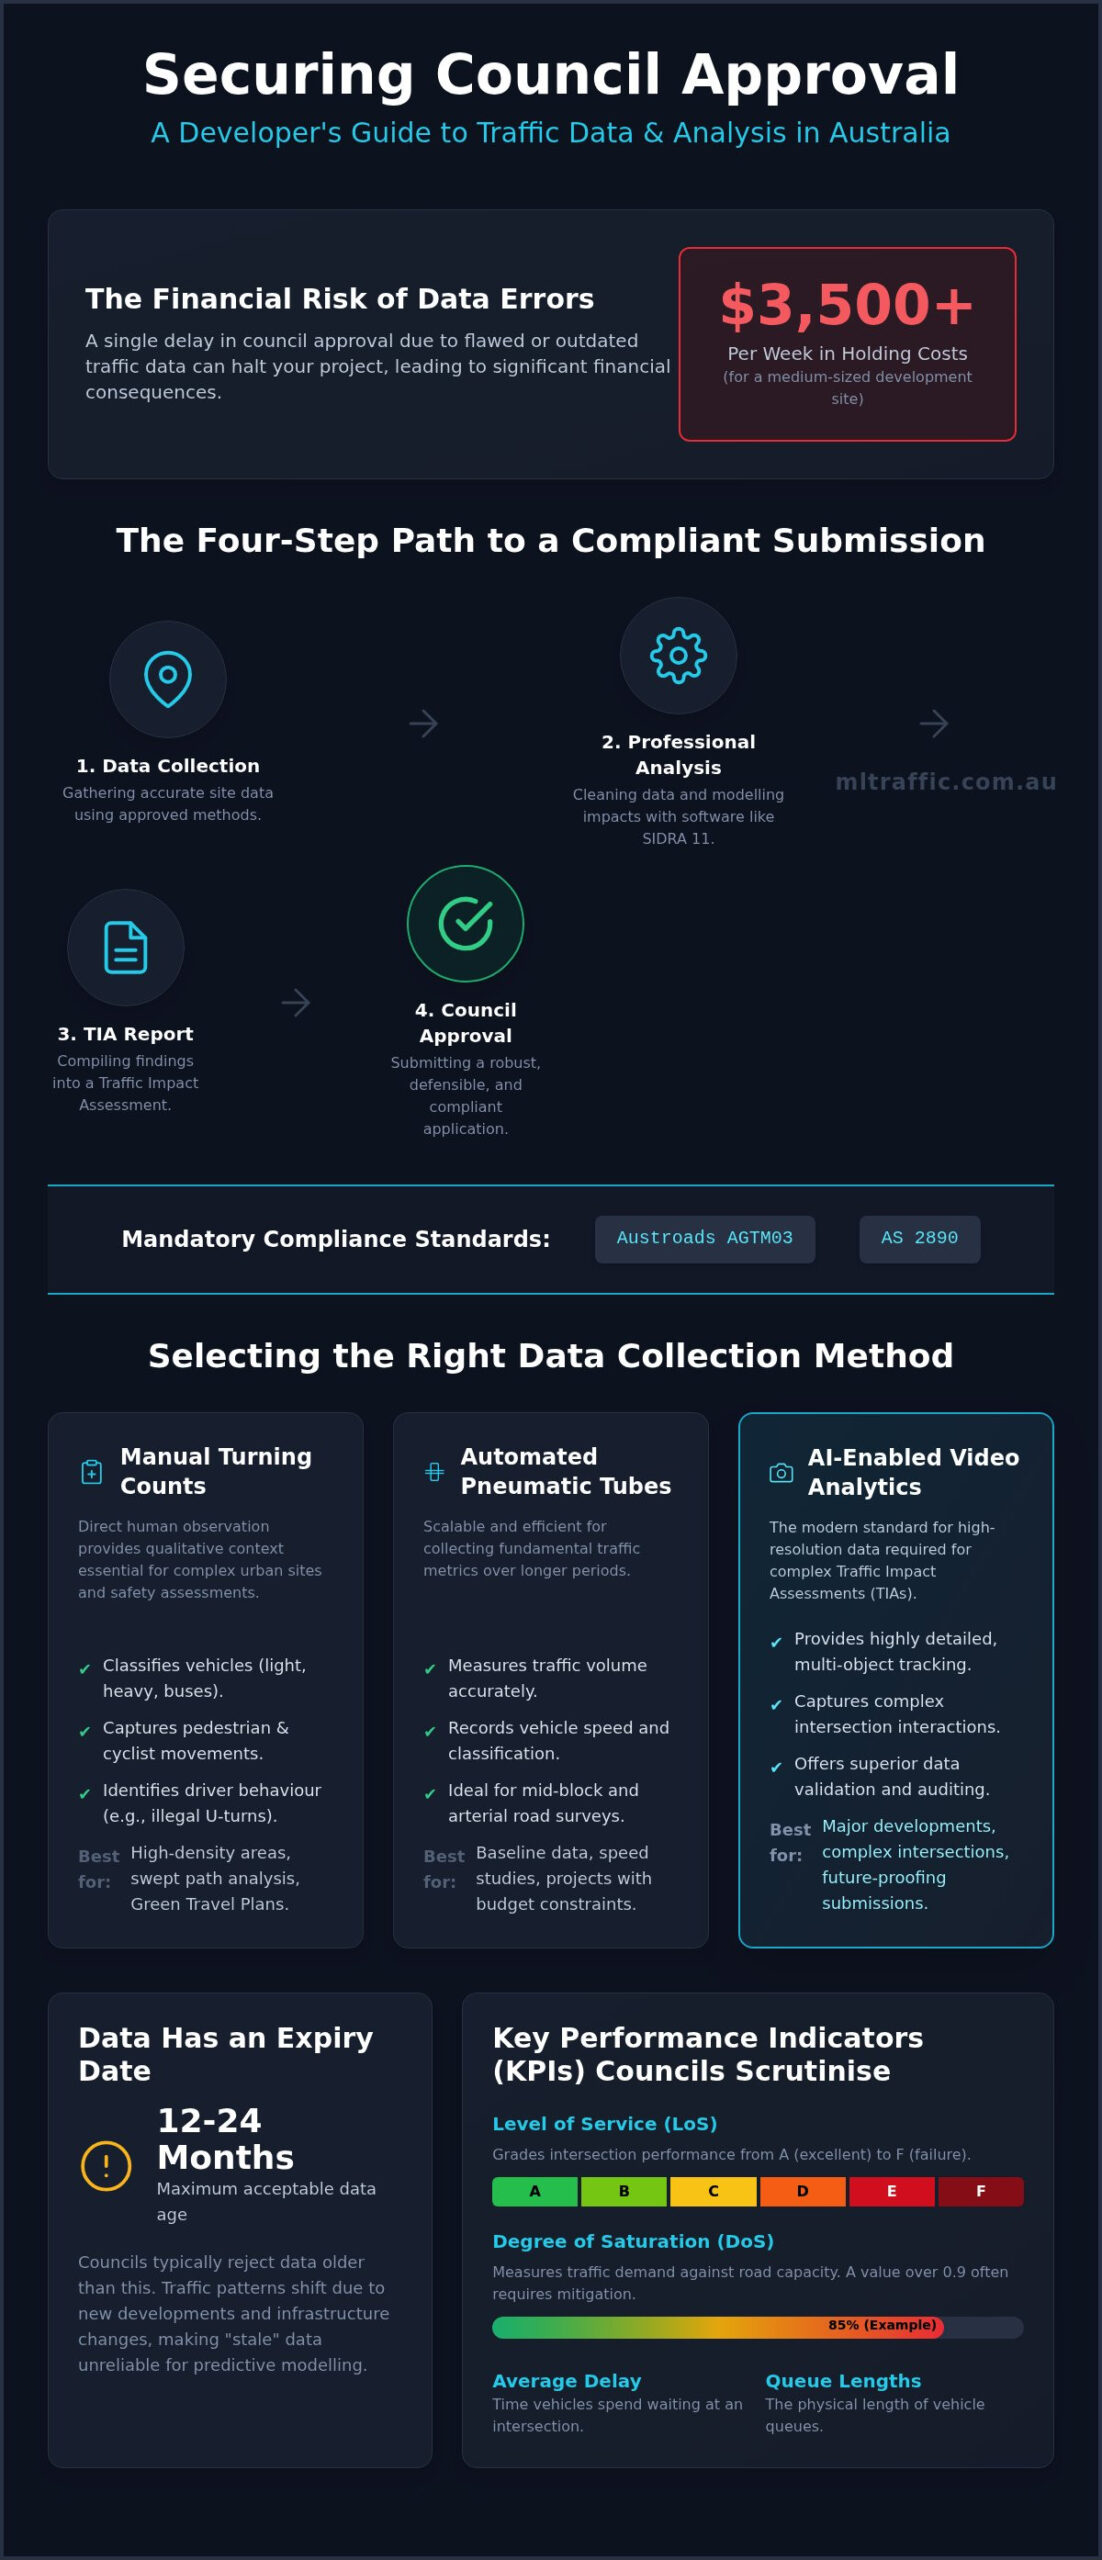
With holding costs for medium-sized Australian development sites exceeding $3,500 per week in 2026, a single delay in council approval due to flawed data is a significant financial risk. Selecting the incorrect traffic data collection and analysis methods doesn’t just waste time; it compromises the entire planning submission. Most developers recognise that accurate vehicle counts are essential, yet many face confusion regarding which specific methodology will satisfy the rigorous scrutiny of local government authorities and state transport departments.
You require a direct path through the technical complexities of manual surveys, pneumatic tubes, and AI-enabled video analytics. This guide provides a technical reference for the methodologies, technologies, and analytical frameworks required to secure planning approvals across Australia. We detail the distinctions between manual and automated systems, explain the latest Austroads requirements, and provide the technical insight needed to interpret traffic reports with confidence. From the implementation of SIDRA INTERSECTION 11 to the nuances of the updated Cowan headway distribution, we outline the professional standards that ensure your development remains compliant and avoids unnecessary delays.
Key Takeaways
- Adhere to Austroads AGTM03 and AS 2890 standards to ensure your traffic study meets mandatory council submission requirements.
- Select between manual turning movement counts and automated pneumatic tubes based on specific site requirements and project budget.
- Implement advanced traffic data collection and analysis methods, such as AI-video analytics, to provide the high-resolution data required for modern Traffic Impact Assessments.
- Utilise industry-standard software like SIDRA INTERSECTION 11 to convert raw data into defensible intersection performance models.
- Validate data through professional cleaning and outlier removal to prevent technical errors and avoid expensive planning delays.
What is Traffic Data Collection and Analysis in the Australian Context?
Traffic data collection and analysis is the systematic process of gathering, processing, and interpreting road user movements to inform infrastructure planning. In Australia, this process is strictly governed by the Austroads Guide to Traffic Management Part 3 (AGTM03). This document ensures that every study, whether for a small residential subdivision or a major commercial hub, follows a standardised framework. Effective traffic data collection and analysis methods distinguish between four primary metrics: volume, speed, vehicle classification, and lane occupancy. To accurately assess network performance, practitioners utilise various Manual and automated traffic counting methods to capture real-time road usage.
Raw data alone is insufficient for a successful development application. Numbers on a spreadsheet don’t account for local congestion patterns or intersection bottlenecks. Professional engineering oversight is required to transform raw counts into a comprehensive Traffic Impact Assessment (TIA) Report. This analysis validates the data against historical trends and removes anomalies caused by roadworks or accidents. Without this rigorous interpretation, your submission lacks the technical weight required to withstand council scrutiny.
The following video outlines the procedural requirements for field-based traffic counting:
The Importance of Data for Development Applications (DA)
Current data establishes the baseline for any planning submission. It proves the existing state of the road network before your development adds a single vehicle. Councils typically reject data older than 12 to 24 months, classifying it as “stale.” This is because traffic patterns shift rapidly due to nearby developments or infrastructure upgrades. We use this baseline data in predictive modelling to forecast how your project will impact local traffic flow. Accurate data ensures your forecasts are realistic, reducing the risk of council requesting expensive revisions or additional studies midway through the approval process.
Key Performance Indicators in Traffic Analysis
Council engineers focus on specific Key Performance Indicators (KPIs) when reviewing your report. The most critical is the Level of Service (LoS), which grades intersection performance from A (excellent) to F (failure). Closely linked is the Degree of Saturation (DoS), a ratio measuring the demand against the capacity of a specific road or intersection. We also analyse Average Delay and Queue Lengths. These metrics determine if a development requires physical upgrades, such as new turn lanes or signal adjustments. Demonstrating a manageable DoS and acceptable queue lengths is often the difference between a prompt approval and a protracted dispute.
Manual Traffic Data Collection Methods
Manual traffic data collection and analysis methods remain the industry benchmark for high-stakes urban developments. While automated systems offer scale, direct human observation provides the qualitative context required for complex site assessments. Observers don’t just count vehicles; they classify them into specific categories such as light vehicles, heavy vehicles (HV), and buses. This classification is vital for conducting an accurate Vehicle Swept Path Analysis. Manual surveys are also the only reliable way to capture active transport data, including pedestrian and cyclist movements, which are now mandatory components of modern “Green Travel Plans” within DA submissions.
The “human element” is particularly important when evaluating road safety and driver behaviour. A trained observer can identify near-misses, illegal U-turns, or non-compliant lane usage that a sensor would simply ignore. For projects in high-density areas, these qualitative insights are often what council engineers look for when assessing the safety of a proposed driveway or intersection upgrade. While state-level datasets like Main Roads WA Open Data provide a useful regional baseline, they can’t replace the site-specific accuracy of a manual count conducted during your project’s critical peak periods.
Intersection and Turning Movement Surveys
Intersection Turning Movement Counts (TMCs) are essential for any project involving a Traffic Impact Assessment (TIA) Report. Field staff use electronic handheld counters to record every individual movement at a junction. This usually occurs during the morning and afternoon peak periods to establish the Peak Hour Factor (PHF), which is a vital input for SIDRA modelling. Unlike automated tubes, a human observer can identify and record “queue tailbacks” or instances where a blocked exit prevents vehicles from clearing an intersection. This level of detail ensures the modelling reflects real-world congestion rather than just theoretical flow.
Parking Accumulation and Duration Studies
Parking accumulation and duration studies involve “beat counts” where staff record number plates at 15 to 30-minute intervals. This process determines the average duration of stay and the peak accumulation of vehicles. This data is a core requirement for Car Parking Demand Assessments. By identifying illegal parking or over-stay patterns, engineers can more accurately predict how a new development will influence local parking availability. For many developers, detailed duration data provides the evidence needed to justify a reduction in statutory parking rates, significantly lowering construction costs. If your project requires precise site-specific data to satisfy council queries, you can consult with our senior traffic engineers to organise a compliant survey programme.
Automated Traffic Counting (ATC) Technologies
Automated technologies provide the longitudinal data sets necessary for calculating Average Daily Traffic (ADT) and identifying seasonal fluctuations. While manual counts capture precise turning movements, automated traffic data collection and analysis methods offer the 24/7 coverage required by councils to verify road usage over a standard seven-day period. These technologies range from temporary on-road sensors to permanent infrastructure embedded in the pavement. In 2026, a standard pneumatic tube survey for a seven-day period typically costs between $600 and $1,200 per location, making it a cost-effective baseline for most development applications.
Pneumatic Road Tubes (The “Black Rubber Cables”)
Pneumatic road tubes are the most frequent choice for short-term automated surveys. These units operate by recording air pulses as vehicle axles pass over the tube, allowing for the calculation of volume, speed, and axle-based classification. They are the primary tool for establishing 7-day volume profiles. However, accuracy decreases in heavy congestion where slow-moving vehicles fail to generate sufficient air pressure. They are also unsuitable for use near intersections where braking or turning can dislodge the tubes or lead to double-counting. For these reasons, professional oversight is essential to ensure the equipment is placed in a location that yields reliable data.
Inductive Loops and SCATS Data
Permanent data collection relies heavily on inductive loop detectors. These are wire coils embedded in the road surface that detect changes in the magnetic field as metal vehicle bodies pass above. In Australian metropolitan areas, these loops are integrated with the Sydney Coordinated Adaptive Traffic System (SCATS). Accessing SCATS data or state-managed telemetry datasets, such as the Victorian “Telemetry Traffic Counts and Vehicle Classification” released on 23 July 2026, allows engineers to perform long-term trend analysis. This ensures that the “Design Day” used in your modelling reflects typical conditions rather than a seasonal outlier. Comparing this permanent data with site-specific counts is a standard requirement for major Intersection Analysis projects.
Radar and Microwave Sensors
For high-speed corridors or heavy-traffic arterials where tube installation poses a safety risk to field staff, non-intrusive radar or microwave sensors are preferred. These units are mounted on roadside poles and use wave reflection to monitor traffic flow across multiple lanes. They provide high-accuracy data without disrupting traffic or requiring road closures. While the hardware cost is higher than pneumatic tubes, the reduction in traffic management requirements often makes them a viable alternative for high-volume road corridors. Regardless of the hardware used, the raw data requires cleaning by a qualified engineer to remove anomalies before it can support a Traffic Impact Assessment (TIA) Report.
Digital and AI-Driven Analysis Methods
Digital transformation has fundamentally altered how we approach traffic data collection and analysis methods. By 2026, the reliance on physical hardware has shifted toward integrated digital twins and AI-enabled analytics. These methods provide a level of granularity that traditional pneumatic tubes cannot match. This is particularly true in high-density urban environments where multi-modal movements involving vehicles, e-scooters, and pedestrians are common.
Computer Vision and AI Video Processing
This technology replaces manual observers with high-definition cameras and machine learning algorithms. One primary advantage is 100% auditability. If a council engineer questions a specific turning movement or queue length, the footage can be re-processed or reviewed manually. This is especially useful for Swept Path Analysis verification, where visual proof of vehicle clearance is required. AI video processing allows for the simultaneous tracking of multiple variables, including speed, gap acceptance, and lane occupancy. The cost-benefit ratio of video is superior for complex sites because it eliminates the need for multiple manual observers. All video data collection must strictly adhere to Australian Privacy Principles. This ensures that individual license plates and faces are anonymised during the data processing phase.
Floating Car Data and Telematics
Leveraging GPS data from providers like Google, TomTom, or specialised telematics firms allows for the creation of Origin-Destination (O-D) matrices. In February 2026, Planwisely launched “Road Traffic Data,” providing a comprehensive view of vehicle movements across Australia. This data validates travel time surveys without the need for manual chase cars or physical sensors. It offers a macro view of how traffic enters and exits a development precinct. This insight is vital for large-scale commercial projects that require broad network analysis beyond the immediate site frontage.
LiDAR (Light Detection and Ranging) technology provides high-precision 3D mapping of traffic flow. It captures the exact trajectories of road users with centimetre-level accuracy. This is becoming increasingly relevant as the Australian Government prepares to implement a national framework for automated vehicles by the end of 2026. Connected vehicle data, or V2X communication, provides real-time safety analysis by monitoring how modern vehicles interact with smart infrastructure. These advanced datasets ensure that your development is future-proofed against upcoming regulatory shifts in the Australian transport sector. Integrating these digital traffic data collection and analysis methods into your planning submission demonstrates a commitment to long-term network safety. To ensure your project utilises the most accurate digital data available, review our expert traffic data collection services.
From Raw Data to Council Approval: The Analysis Phase
Raw data serves as the foundation, but the analysis phase determines the success of a development application. Professional traffic data collection and analysis methods involve a rigorous validation process to ensure the integrity of the results. We filter the raw logs to remove “outlier” days that don’t represent typical conditions. This includes data captured during school holidays, public holidays, or periods of significant roadworks that skew results. Following the February 2026 update to the Austroads Guide to Traffic Management Part 2, we now apply the Cowan headway distribution for more robust gap acceptance modelling. This ensures your submission reflects the most current theoretical frameworks accepted by state road authorities.
Once the data is cleaned, we perform a gap analysis to determine if the existing road network can absorb the “Development Generated Traffic.” If the analysis indicates that local capacity is exceeded, we develop mitigation strategies. These might involve signal timing adjustments, lane reconfiguration, or specific upgrades identified through a professional Intersection Analysis. The goal is to prove that the development won’t detrimentally impact the safety or efficiency of the surrounding precinct.
SIDRA Modelling and Capacity Analysis
SIDRA INTERSECTION 11, released in March 2026, is the premier software for capacity analysis in Australia. It’s the standard tool for assessing intersection performance. We input site-specific data to calculate the Degree of Saturation (DoS), Level of Service (LoS), and Average Delay. These metrics provide the technical evidence required to satisfy council engineers. Our senior-led approach ensures that modelling parameters are calibrated correctly, preventing the “black box” errors that often lead to council RFI (Request for Further Information) letters. These results are integrated directly into our Traffic Impact Assessment (TIA) Reports to provide a defensible case for your project.
The Final Report: Presenting Data to Council
The final report translates complex technical data into a clear, persuasive argument for council planners. We use high-resolution visualisations, including heat maps and flow diagrams, to demonstrate traffic distribution. This evidence is crucial for addressing the traffic and transport requirements of your Statement of Environmental Effects (SEE). Every report we produce ensures strict compliance with the Australian Standards for Parking and Access, specifically AS 2890. By linking rigorous traffic data collection and analysis methods to practical design solutions, we provide the technical assurance needed to secure your DA approval without unnecessary delays.
Securing Your Development Approval with Data Integrity
Selecting the appropriate traffic data collection and analysis methods is the first step toward a successful planning submission. Whether your project requires manual turning counts to capture pedestrian interaction or 7-day pneumatic tube surveys for volume profiling, the methodology must align with Austroads AGTM03 standards. Raw data lacks the technical weight required by local councils; it is the professional interpretation, rigorous cleaning, and advanced modelling that transform these numbers into a compliant Traffic Impact Assessment.
ML Traffic Engineers Australia brings over 15 years of expert traffic engineering consultancy to your project. Our senior principals are directly involved in every technical report, ensuring your data withstands the most demanding regulatory scrutiny. We leverage comprehensive national experience with local council requirements to bridge the gap between raw field counts and final approval. Our hands-on approach guarantees that the same expert who initiates your project performs the technical work.
Contact ML Traffic Engineers Australia for a Professional Traffic Assessment to ensure your next development remains on schedule and within budget. We look forward to supporting your project’s success.
Frequently Asked Questions
Why can’t I just use Google Maps traffic data for my DA?
Google Maps provides travel time trends and congestion overlays but lacks the specific vehicle counts and turning movement data required by Austroads AGTM03. Councils require verifiable, timestamped raw data that accounts for specific vehicle classes and peak hour volumes. Google’s aggregated data is proprietary and doesn’t meet the evidentiary standards of a formal Traffic Impact Assessment.
What is the difference between a volume count and a classified count?
A volume count records the total number of vehicles passing a specific point, whereas a classified count categorises those vehicles into types such as light vehicles, heavy vehicles, and buses. Classified counts are essential for conducting a Vehicle Swept Path Analysis and determining the structural impact on the road pavement. Most modern traffic data collection and analysis methods prioritise classified data to ensure modelling accuracy.
How long is traffic data considered “valid” by Australian councils?
Most Australian councils consider traffic data valid for 12 to 24 months from the date of collection. If significant infrastructure changes or large developments have been completed in the vicinity since the count, council engineers will likely require a fresh survey. Using “stale” data often results in a formal Request for Further Information (RFI), which can delay your project approval.
Do I need to collect data during school holidays or public holidays?
No, standard surveys must be conducted during “neutral” weeks to represent typical conditions. This excludes school holidays, public holidays, and major local events that disrupt standard traffic patterns. Data collected during these periods is considered unrepresentative of the average network load and is generally rejected by assessing authorities during the planning process.
What is SIDRA modelling and why does my traffic engineer use it?
SIDRA Intersection is a micro-analytical software tool used to evaluate the capacity and performance of intersections. Your engineer uses it to calculate the Degree of Saturation and Level of Service. It’s the industry standard for proving that an intersection can safely handle the additional traffic generated by your new development without causing excessive delays.
How much does a standard 7-day traffic count cost in Australia?
A standard 7-day pneumatic tube count typically costs between $600 and $1,200 per location. For more complex requirements, such as video-based intersection counts, prices generally range from $1,500 to $3,500. These costs vary based on the number of lanes, the complexity of movements, and the required traffic management for equipment installation. Professional traffic data collection and analysis methods ensure this investment provides defensible evidence for your DA.
Can video AI replace human traffic observers entirely?
Video AI has largely replaced human observers for high-volume counts due to its 100% auditability and consistency. However, human engineers are still required to validate the AI output and interpret qualitative factors. Humans remain superior for identifying specific behavioural nuances, such as illegal parking patterns or site-specific access issues that algorithms might misinterpret in complex urban environments.
What is a Peak Hour Factor (PHF) and why is it important for analysis?
The PHF measures the relationship between the total hourly volume and the peak 15-minute flow within that hour. It’s important because it identifies short-term surges in traffic that can cause temporary intersection failure. A low PHF indicates highly concentrated traffic, which requires more robust intersection design to prevent queuing and safety hazards during the busiest periods of the day.

Disclaimer
The content on www.mltraffic.com.au, including all technical articles, guides, and resources, is provided for general informational and educational purposes only. It is not intended to constitute professional advice in traffic engineering, transportation planning, development approvals, or any other technical or legal field.
While ML Traffic Engineers makes every reasonable effort to ensure the accuracy, completeness, and timeliness of the information published, we do not provide any warranties or representations (express or implied) regarding its reliability, suitability, or availability for any particular purpose. Any reliance you place on the content is strictly at your own risk.
In no event shall ML Traffic Engineers, its directors, employees, authors, or affiliates be liable for any direct, indirect, incidental, special, consequential, or punitive damages (including, without limitation, loss of profits, data, or business opportunities) arising out of or in connection with the use of, or inability to use, any information provided on this website.
The articles and guides on this site are not a substitute for engaging a qualified, registered professional traffic engineer (such as an NPER or RPEQ engineer) to assess your specific project requirements. For tailored advice, compliance assessments, or traffic engineering services, please contact a competent professional.
This disclaimer may be updated from time to time without notice. By accessing or using this website, you agree to be bound by the most current version of this disclaimer.
