

A technical data dump is the fastest way to lose stakeholder interest and stall project approvals. When you present raw metrics without context, you risk misinterpretation and unnecessary scrutiny from regulatory bodies during the planning process. Mastering the art of visualising traffic data for stakeholder presentations is no longer optional; it’s a critical requirement for any successful infrastructure project. Professional visual communication bridges the gap between dense engineering data and decisive project buy-in.
It’s frustrating when stakeholders disengage or misinterpret critical flow metrics, leading to avoidable delays in DA submissions. This guide provides a professional framework for transforming complex traffic metrics into persuasive visual narratives that secure project approvals. You’ll learn how to leverage current analytical tools and industry standards to increase your credibility with regulatory bodies. We’ll examine specific techniques for presenting Traffic Impact Assessments, vehicle swept paths, and intersection analyses that resonate with non-technical decision-makers. By the end of this article, you’ll have a clear strategy for faster planning approvals and clearer communication of project benefits.
Key Takeaways
- Understand why the final presentation of technical data is the deciding factor in securing planning approvals for Development Applications.
- Learn how to segment your audience to provide Council officers with technical depth while giving developers high-level commercial clarity.
- Discover how to replace static tables with dynamic tools like intersection flow diagrams and heatmaps to prevent stakeholder disengagement.
- Master the professional framework for visualising traffic data for stakeholder presentations to turn technical compliance into a persuasive project narrative.
- Ensure project continuity and accountability by working with senior traffic engineering principals who manage the entire assessment process from start to finish.
The Role of Data Visualisation in Traffic Engineering Approvals
In professional consultancy, data visualisation is the bridge between technical calculation and regulatory approval. It’s the strategic translation of complex metrics into a format that council planners can verify quickly. The success of a Development Application (DA) often relies on this “last mile” of communication. While the underlying engineering must be flawless, a project can fail if the decision-makers can’t interpret the results. Clear visuals prevent the disengagement that occurs when stakeholders are presented with dense, uncontextualised data sets.
We’ve moved beyond simple raw data reporting. Today, visualising traffic data for stakeholder presentations is about demonstrating project viability and safety through clear, evidence-based graphics. It’s not about decoration; it’s about reducing the cognitive load on the reviewer. Professional visuals allow planners to see the logic behind a design immediately, which builds immediate credibility for the project team. When you present data that is easy to digest, you reduce the likelihood of misinterpretation and project-stalling questions.
To better understand this concept, watch this helpful video:
Bridging the Gap Between Engineering and Planning
Technical accuracy alone doesn’t secure approvals. If a non-expert stakeholder can’t understand the impact of a proposed development, the default response is often a Request for Information (RFI) or a formal refusal. These delays are costly and often result from a lack of clarity in the initial submission. We use visuals to translate complex SIDRA intersection outputs into real-world narratives. This approach shows exactly how traffic flows will change, turning abstract numbers into a tangible understanding of site performance and safety.
Visualisation as a Tool for Regulatory Compliance
Compliance is the foundation of every report. Visual tools provide definitive proof that a design meets Australian Standards, such as AS 2890 for parking and access. For instance, a Traffic Impact Assessment (TIA) Report must clearly illustrate Sight Distance Assessments and driveway access designs to be considered valid. By providing a spatial context for understanding traffic flow, we ensure that regulatory bodies see the compliance directly. This meticulous approach to visual evidence minimises friction during the planning process and supports faster project timelines.
Choosing the Right Visualisation for Different Stakeholder Groups
Identifying the primary audience is the foundational step in effective data communication. When visualising traffic data for stakeholder presentations, the visual strategy must change to meet the specific expectations of the reviewer. Council planners require definitive proof of safety and compliance with regulatory standards. Developers seek evidence of project feasibility and commercial yield. Community members often focus on local impact and immediate congestion. Each group processes information differently, so your presentation must align with their primary objectives.
- Council Officers: Focus on safety, network capacity, and strict adherence to Australian Standards.
- Developers and Investors: Focus on car park yield, cost-effective design, and project feasibility.
- Community Groups: Focus on local traffic flow, pedestrian safety, and environmental impact.
Calibrating technical detail is essential for maintaining engagement and authority. Overloading a presentation with raw SIDRA output or dense spreadsheets leads to confusion and unnecessary questioning. Instead, professional consultants use advanced data visualization techniques to highlight specific outcomes like queue lengths or delay times. We follow the “One Point” rule: every visual must communicate one clear takeaway. This ensures that the core message isn’t lost in technical noise. When visualising traffic data for stakeholder presentations, the goal is to make the data undeniable and easy to verify.
Presenting to Local Councils and Authorities
Council officers and authorities focus on safety, compliance, and broader network capacity. Use technical diagrams to pre-emptively answer common planning objections regarding traffic volume or pedestrian safety. For instance, a detailed Vehicle Swept Path Analysis provides visual proof of site accessibility for heavy vehicles, emergency services, or waste collection. This level of detail demonstrates strict adherence to AS 2890 and directly addresses the concerns of regulatory bodies, reducing the likelihood of a Request for Information (RFI).
Communicating with Developers and Investors
Developers and investors prioritise car park demand and yield optimisation. Visualising cost-effective design solutions that meet regulatory standards is vital for project viability. We demonstrate how traffic engineering supports project feasibility by illustrating efficient car park designs and access points. This approach helps stakeholders understand the commercial benefits of a well-designed traffic plan and how it impacts the overall site layout. If you require a professional Traffic Impact Assessment (TIA) Report that addresses these diverse needs, our senior principals provide hands-on expertise to ensure your project progresses without unnecessary technical hurdles.
Beyond Static Tables: Effective Techniques for Traffic Data
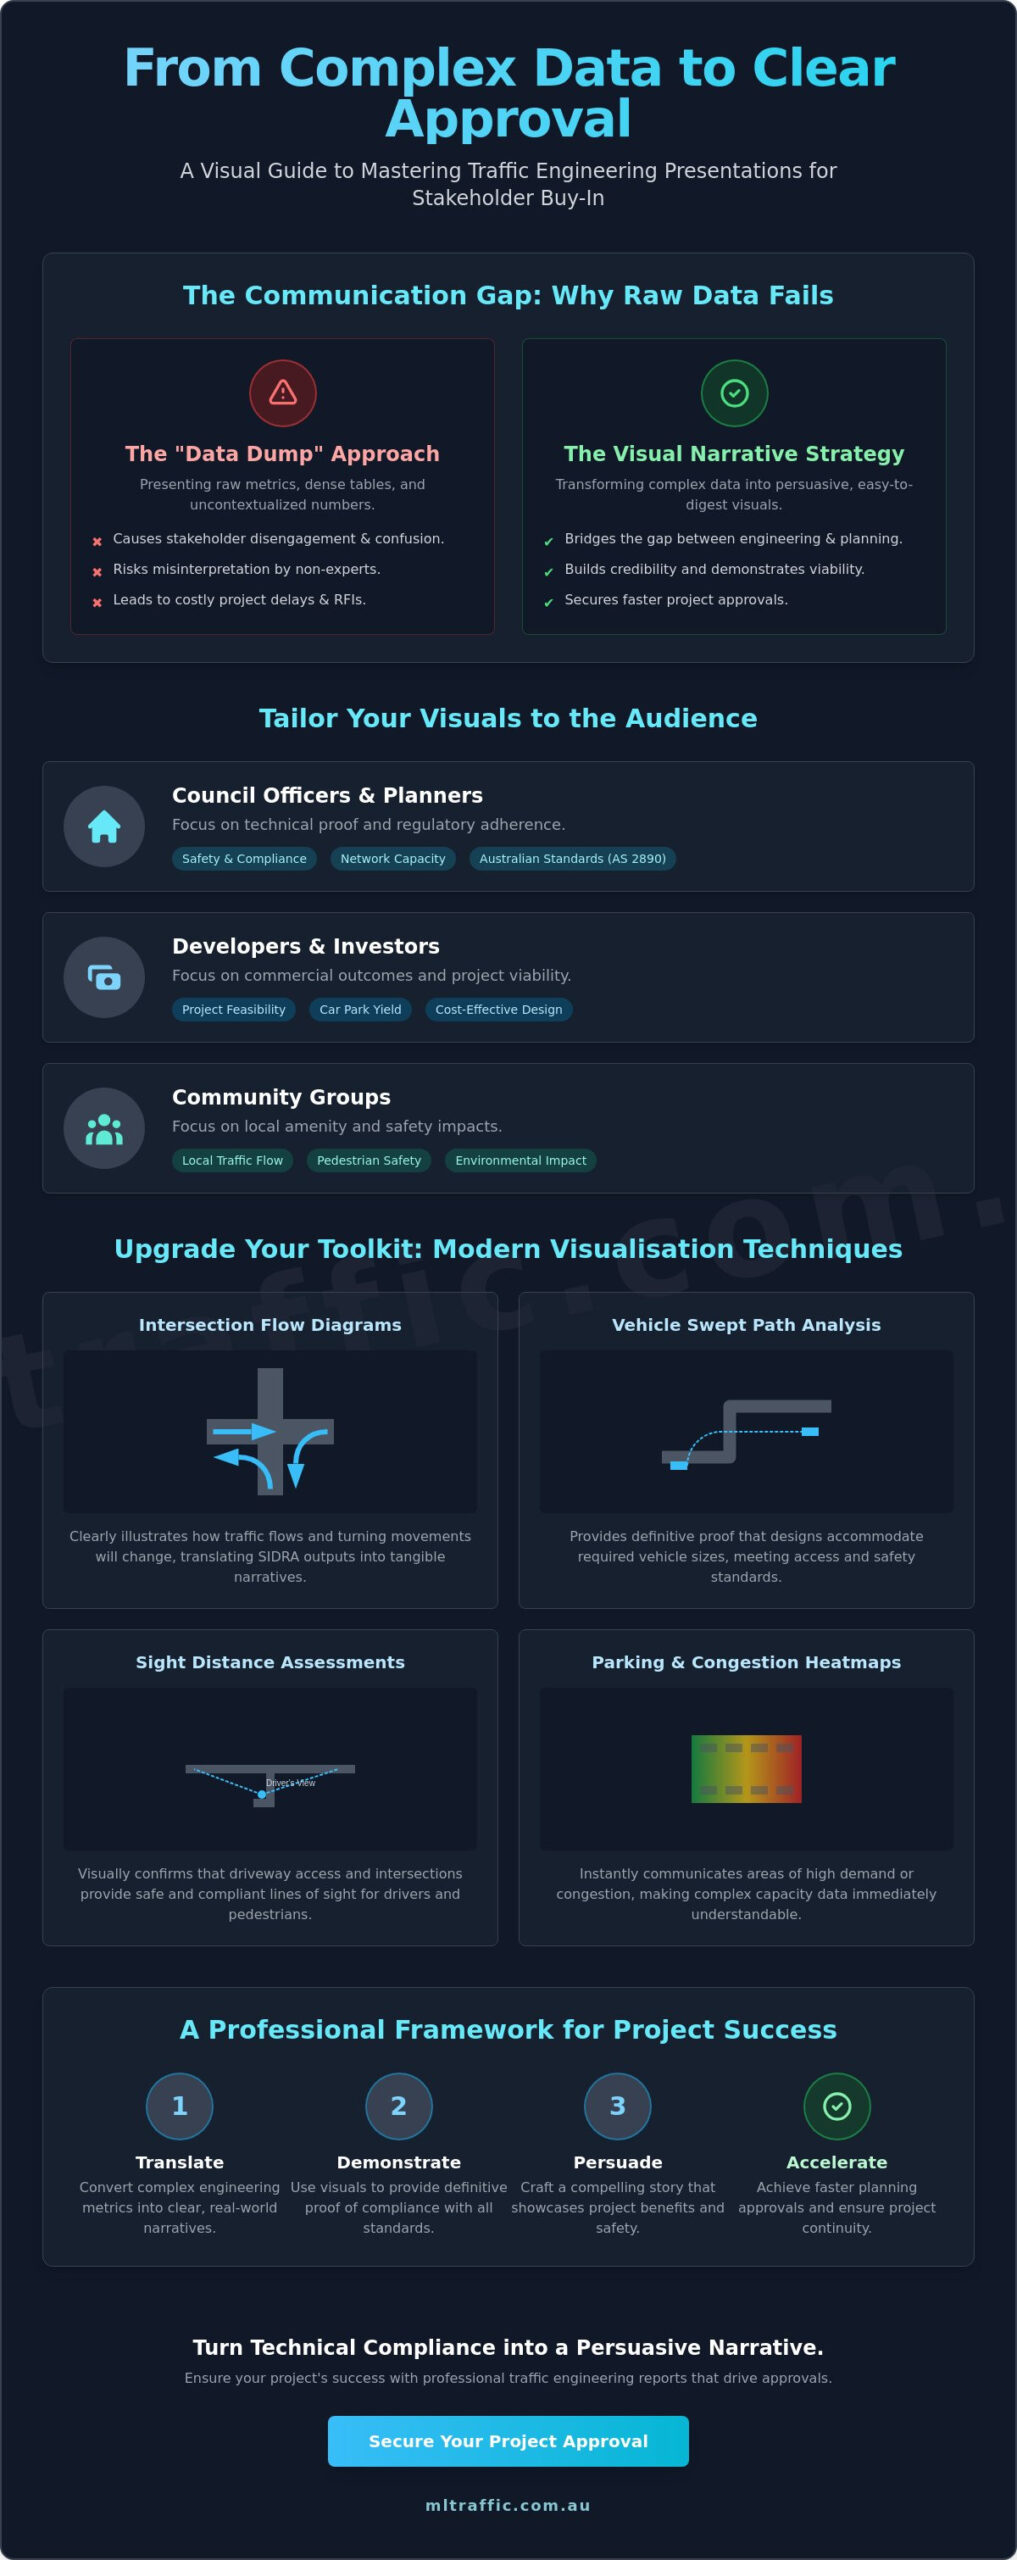
Traditional PDF reports often suffer from “data dumping.” This practice forces stakeholders to navigate pages of static tables to find relevant information. It’s an ineffective way to communicate high-stakes technical findings. Professional visualising traffic data for stakeholder presentations requires a shift toward intuitive graphics that highlight specific project outcomes. We transform raw intersection analysis into heatmaps or flow diagrams. These tools allow reviewers to identify bottlenecks and flow patterns instantly without sifting through hundreds of spreadsheet rows.
Spatial clarity is fundamental to successful project approvals. A recent survey of traffic data visualization methods confirms that spatial representations are far more effective for conveying urban mobility patterns than standard text-based reports. We’ve found that 3D modelling in complex car park design presentations is the best way to ensure ramp grades and vertical clearances are verified visually. This approach provides assurance to developers that the design is functional and compliant before any physical work commences.
Visualising Vehicle Swept Paths and Access
Clear manoeuvring diagrams are essential for proving site accessibility. We move beyond simple lines on a page to provide detailed visual proof of vehicle movements within a site. This is critical for demonstrating compliance for heavy vehicles, emergency services, and waste management trucks. For a deeper look at how these diagrams support project approvals, refer to our comprehensive guide on Swept Path Analysis. These visualisations provide the definitive evidence council officers need to approve site access designs and driveway grades.
Intersection and Network Flow Analysis
Communicating the Level of Service (LoS) at a busy intersection requires more than a simple letter grade in a table. We use colour-coded maps to visualise network performance, making it easy to identify areas of peak-hour congestion. Side-by-side visuals comparing “Existing” vs. “Proposed” conditions provide immediate context for the project’s traffic impact. This simplification is particularly useful during public exhibition periods. It allows us to explain complex queueing data clearly to community stakeholders who lack an engineering background. By presenting data this way, we reduce the risk of project-stalling objections based on misunderstood metrics.
Best Practices for Presenting Technical Compliance to Non-Experts
Presenting technical compliance requires more than just showing the numbers; it requires a strategic framework to ensure those numbers lead to a project approval. Effective visualising traffic data for stakeholder presentations relies on the ‘Think, Focus, Simplify’ framework. First, identify the specific regulatory hurdle the data must clear. Second, remove any secondary technical noise that doesn’t directly support that objective. Finally, simplify the presentation format so the conclusion is undeniable to a non-expert reviewer. This process preserves the engineering integrity while making the findings accessible.
Technical authority is maintained through precision, not jargon. While industry-standard acronyms like LoS or TIA are necessary in the full report, presentations should focus on the real-world implications of those metrics. Use clear annotations to guide the stakeholder’s eye toward key findings, such as specific queue lengths at peak hours. Every visual must remain strictly aligned with the broader Traffic Engineering findings to ensure consistency across the entire Development Application (DA) submission.
Simplifying Without Sacrificing Rigour
Aggregating individual data points into observable trends allows stakeholders to grasp the overall network impact without becoming lost in granular fluctuations. Executive summaries act as the essential bridge between technical text and high-impact visuals. They provide the context needed for a council planner to understand why a specific design choice was made. We recommend using call-out boxes for critical compliance metrics, such as demonstrating that a driveway ramp grade meets AS 2890.1 requirements. This ensures that the most important facts are never overlooked during a high-pressure presentation.
Design Principles for Engineering Presentations
Professional design principles ensure that technical diagrams are functional and authoritative. Consistency in colour coding is vital; for example, using green for compliant elements and red for critical areas of concern provides an immediate visual shorthand for the reviewer. Accuracy in scale and geographic context is non-negotiable in civil engineering. A diagram that lacks proper site context will quickly lose credibility with regulatory bodies. Ensure all diagrams are high-resolution and legible in both digital formats and printed reports to prevent any ambiguity during the review process.
Our senior principals at ML Traffic manage every aspect of the technical work and presentation design. This ensures that the expert who performs the analysis is the same person who defends it before the council. For professional assistance with your next submission, contact our senior leadership directly to discuss your project requirements.
How Professional Traffic Engineering Reports Drive Project Success
Engaging a specialist traffic consultant is a strategic investment in stakeholder management. A high-quality report does more than present data; it defends the project’s technical integrity before regulatory bodies. At ML Traffic Engineers Australia, our approach is built on direct access to senior leadership. We believe that the expert who initiates the project should be the one performing the technical work and finalising the presentation. This personnel continuity promise ensures that no critical site context is lost in communication between junior staff and the client.
Our reports are designed to combine technical depth with the presentation clarity required for rapid approvals. When visualising traffic data for stakeholder presentations, we ensure that every graphic is backed by rigorous intersection analysis and site-specific data. This professional standard provides the assurance stakeholders need to grant approvals without requesting additional information. By providing clear, evidence-based narratives, we help developers and planners navigate complex site constraints while maintaining strict adherence to national regulatory standards.
Our Comprehensive Suite of Assessment Services
We provide a wide range of specialised assessments to support every stage of the planning process. From detailed Traffic Impact Assessment (TIA) Reports to intricate Vehicle Swept Path Analysis and functional Car Park Design, our work provides the visual evidence council planners require. We address complex issues such as sight distance, driveway ramp grades, and waste management planning with meticulous attention to detail. Explore our full range of Traffic Engineering Services to see how our expertise can benefit your specific development type.
Contact ML Traffic Engineers Australia for Your Next Project
Ensuring your development meets Australian Standards is critical for securing planning approvals across the country. Our senior engineers provide expert advice tailored to the specific constraints of your site, whether it’s a residential, commercial, or industrial project. We focus on results-oriented communication that reduces bureaucracy and accelerates project timelines. Contact our senior engineers today to discuss your presentation needs and ensure your next DA submission is supported by professional, authoritative traffic engineering data.
Securing Project Approvals Through Strategic Visual Communication
Effective technical communication is the final hurdle between a well-engineered design and a formal project approval. By transitioning from raw data reporting to strategic visual narratives, you eliminate the ambiguity that often leads to costly Requests for Information (RFIs). This guide has detailed how to segment your audience and apply professional design principles to ensure your technical compliance is both visible and undeniable. Mastering the art of visualising traffic data for stakeholder presentations is now a fundamental requirement for any high-stakes development application.
ML Traffic Engineers Australia offers the reliable expertise and meticulous attention to detail required to navigate the Australian planning landscape. We bring over 15 years of specialist experience to every assessment; providing national coverage and a commitment to technical excellence. Our clients benefit from direct access to senior principals; ensuring that the expert performing the analysis is the one defending it before the council. Secure your project approval with expert traffic reports from ML Traffic Engineers Australia. We are ready to help you achieve a seamless planning outcome for your next project.
Frequently Asked Questions
What are the best tools for visualising traffic data?
Professional engineers at ML Traffic Engineers Australia utilize specialized software such as SIDRA for intersection modelling and AutoCAD for vehicle swept paths. For visualising traffic data for stakeholder presentations, business intelligence tools like Tableau or Power BI are effective for creating interactive dashboards. These tools allow our senior principals to present complex flow patterns in a format that’s easily digestible for non-technical reviewers. Using these tools ensures that technical metrics are accurately represented in a spatial context.
How do I present technical traffic data to a local council?
Focus on safety, network capacity, and strict adherence to Australian Standards like AS 2890. Council planners require definitive proof that a development won’t compromise local road safety or efficiency. Use clear diagrams and annotated maps to pre-emptively address common planning objections. Professional reports should provide direct evidence of site accessibility to minimise the risk of a Request for Information (RFI) during the assessment process.
Why is Swept Path Analysis important for stakeholder presentations?
Swept Path Analysis provides visual proof that specific vehicles can safely enter, exit, and manoeuvre within a site. This is critical for demonstrating that waste collection trucks, emergency services, and delivery vehicles can operate without obstructing public roads. It’s a fundamental requirement for securing council approval for site access designs and driveway ramp grades. Clear swept path diagrams remove any ambiguity regarding a site’s operational functionality.
Can I use standard graphing software for traffic engineering data?
Standard graphing software like Excel can handle basic bar charts but it lacks the spatial precision required for traffic engineering. Professional visualising traffic data for stakeholder presentations requires tools that can overlay traffic volumes onto geographic maps or site plans. Engineering-specific software ensures that queue lengths and flow densities are represented accurately to scale. This level of precision is essential for maintaining technical authority and regulatory compliance.
How do I simplify a Traffic Impact Assessment for a public meeting?
Use colour-coded heatmaps and intuitive flow diagrams to replace dense technical tables. Focus on the real-world impact on local travel times and pedestrian safety rather than abstract engineering metrics. An executive summary should bridge the gap between the technical Traffic Impact Assessment (TIA) Report and the public’s concerns. This approach reduces community friction and clarifies the project’s long-term benefits to the local road network.
What visual evidence is required for AS 2890 compliance?
Compliance with AS 2890 requires dimensioned parking layouts, driveway ramp grade assessments, and vehicle swept path diagrams. These visuals must demonstrate that the design provides adequate clearance and manoeuvring space for the required vehicle classes. Accurate scale and clear annotations are mandatory to prove that the proposed car park design meets national regulatory standards. Providing this evidence visually allows council officers to verify compliance quickly.
How can visualisation reduce the time for DA approval?
Visualisation reduces the time for DA approval by providing council officers with immediately verifiable evidence. Submissions from ML Traffic Engineers Australia ensure that technical competence is demonstrated through clear graphics, which reduces the likelihood of a Request for Information (RFI). This meticulous approach to visual evidence allows regulatory bodies to conclude their assessment more efficiently, leading to faster planning outcomes and fewer project delays.
What is the difference between a data report and a stakeholder presentation?
A data report is a comprehensive technical document containing raw metrics, SIDRA outputs, and detailed calculations for engineering review. In contrast, a stakeholder presentation is a strategic summary designed to secure project buy-in. It focuses on high-level outcomes and persuasive visual narratives that explain the practical implications of the data. The presentation simplifies the technical findings without sacrificing the underlying engineering rigour required for approval.

Disclaimer
The content on www.mltraffic.com.au, including all technical articles, guides, and resources, is provided for general informational and educational purposes only. It is not intended to constitute professional advice in traffic engineering, transportation planning, development approvals, or any other technical or legal field.
While ML Traffic Engineers makes every reasonable effort to ensure the accuracy, completeness, and timeliness of the information published, we do not provide any warranties or representations (express or implied) regarding its reliability, suitability, or availability for any particular purpose. Any reliance you place on the content is strictly at your own risk.
In no event shall ML Traffic Engineers, its directors, employees, authors, or affiliates be liable for any direct, indirect, incidental, special, consequential, or punitive damages (including, without limitation, loss of profits, data, or business opportunities) arising out of or in connection with the use of, or inability to use, any information provided on this website.
The articles and guides on this site are not a substitute for engaging a qualified, registered professional traffic engineer (such as an NPER or RPEQ engineer) to assess your specific project requirements. For tailored advice, compliance assessments, or traffic engineering services, please contact a competent professional.
This disclaimer may be updated from time to time without notice. By accessing or using this website, you agree to be bound by the most current version of this disclaimer.
